Research article
What is driving UK long-term interest rates?
A five-component view of gilt yields and global competition for capital
Global real-rate forces account for much of the rise in UK forward gilt yields since 2019. UK inflation compensation is also higher, while the division between global and UK-relative real compensation depends on the benchmark and expectation assumptions.
The five-year, five-year forward gilt rate rose from about 1.1% at the end of 2019 to 5.65% in July 2026. The quoted rate is continuously compounded: 5.649% corresponds to about 5.730% with semi-annual compounding or 5.812% as an annual-effective rate. That is a substantial increase in the price of borrowing well beyond the immediate policy cycle. How much reflects the world economy, and how much reflects the risks attached to lending to Britain?
The Bank of England’s analysis of long rates in 2025 emphasised real compensation and global influences. We extend that perspective over a longer history and split real compensation into a foreign benchmark and a UK-relative component. The resulting picture gives global forces a central role, while leaving an important inflation question for domestic policymakers.
Five components help explain the forward rate
A five-year, five-year forward rate, usually shortened to 5y5y, is the rate implied by today’s gilt curve for a five-year loan beginning five years from now. It helps us look beyond the next few Bank Rate decisions. It combines expectations of future short rates with the compensation investors require for holding longer-dated bonds.
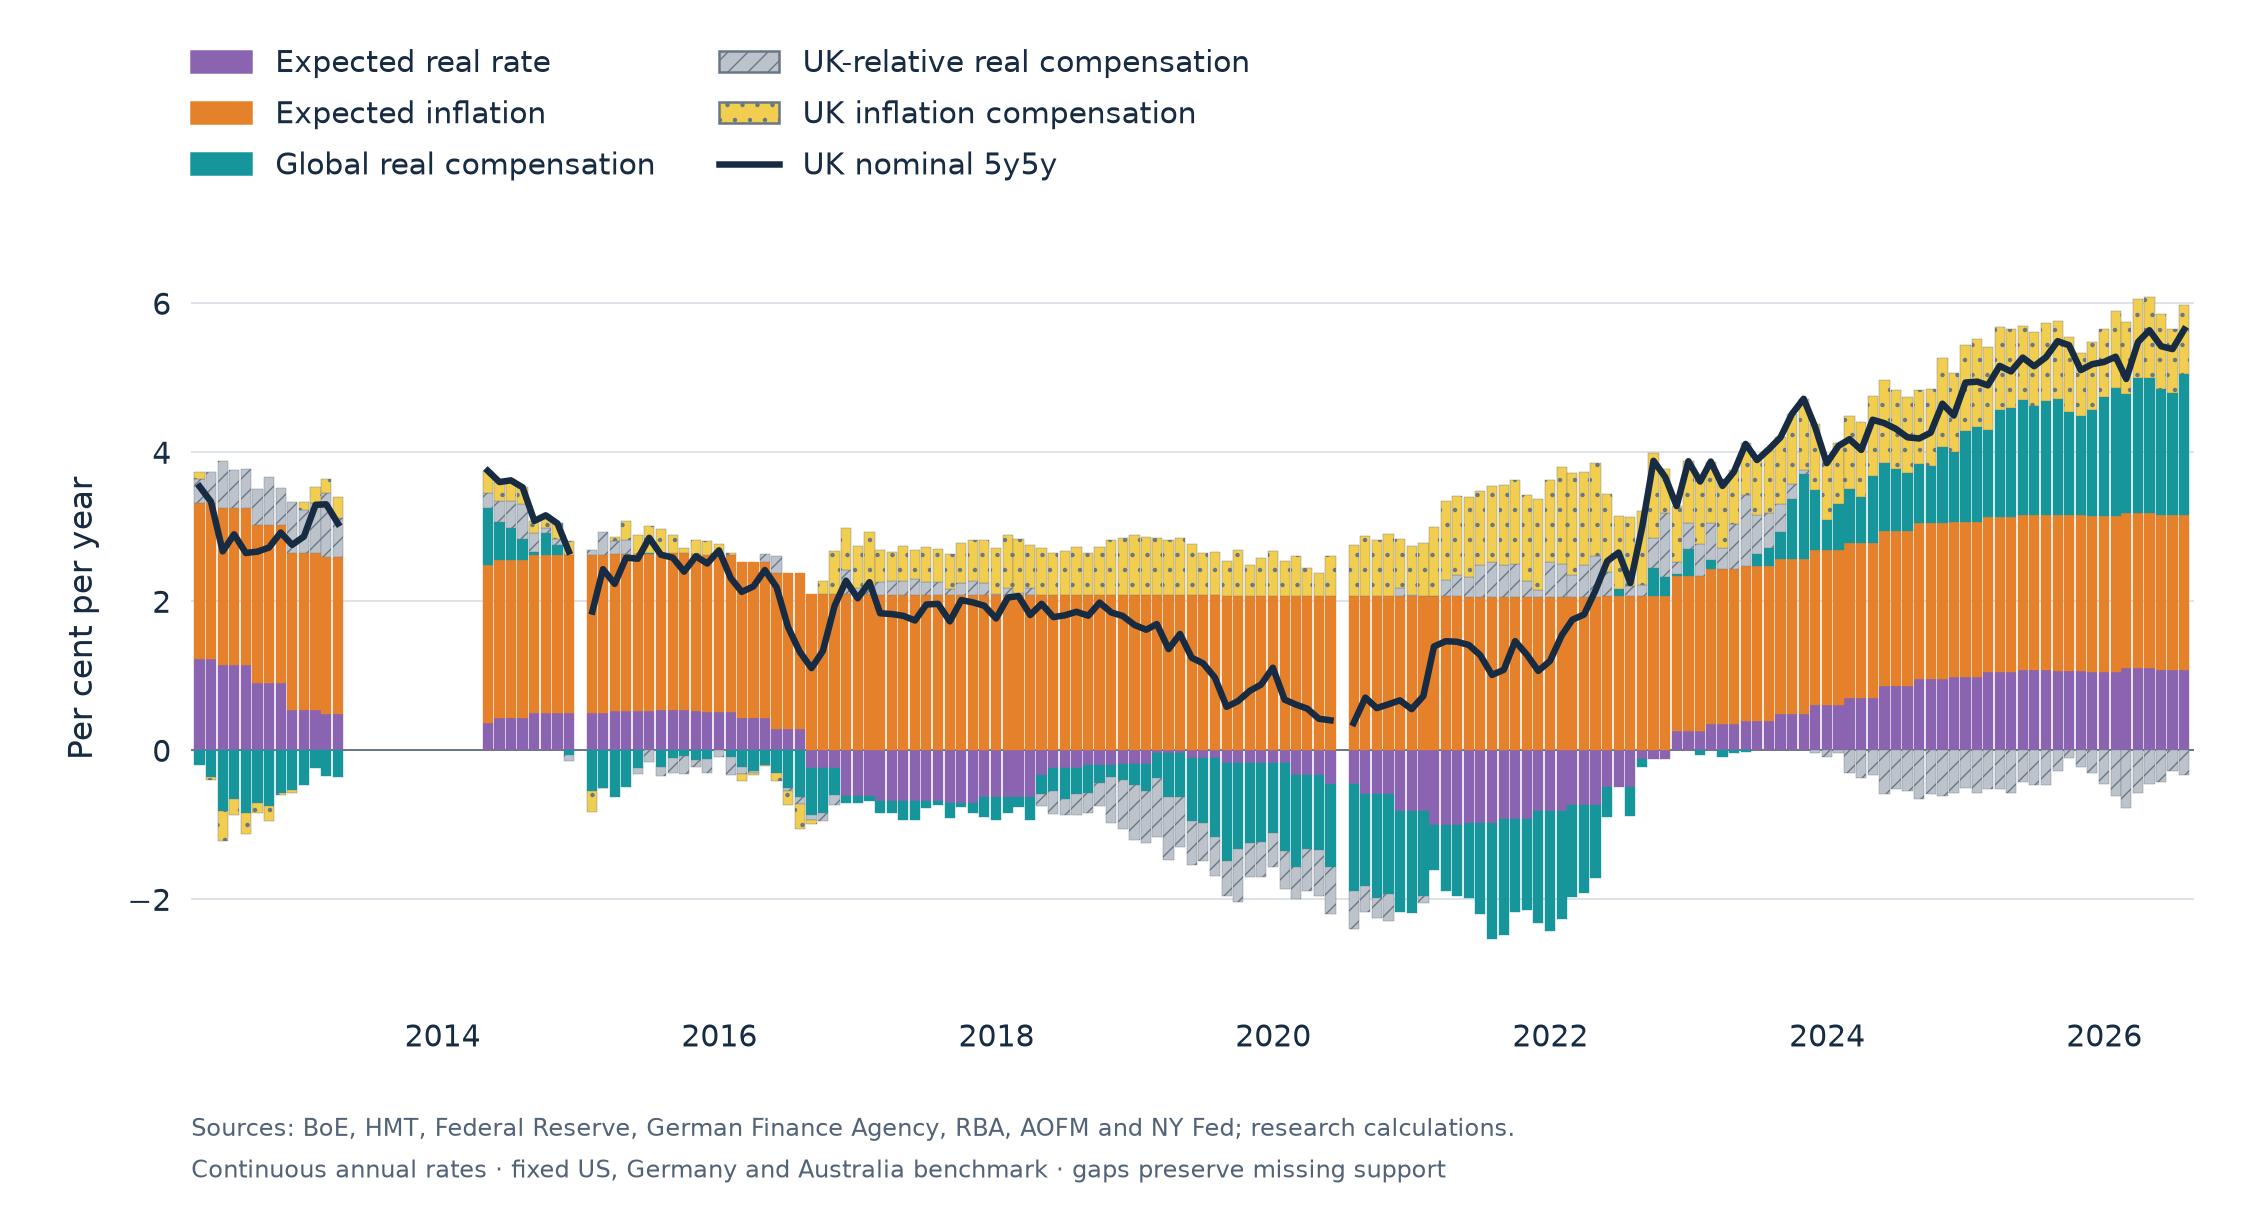
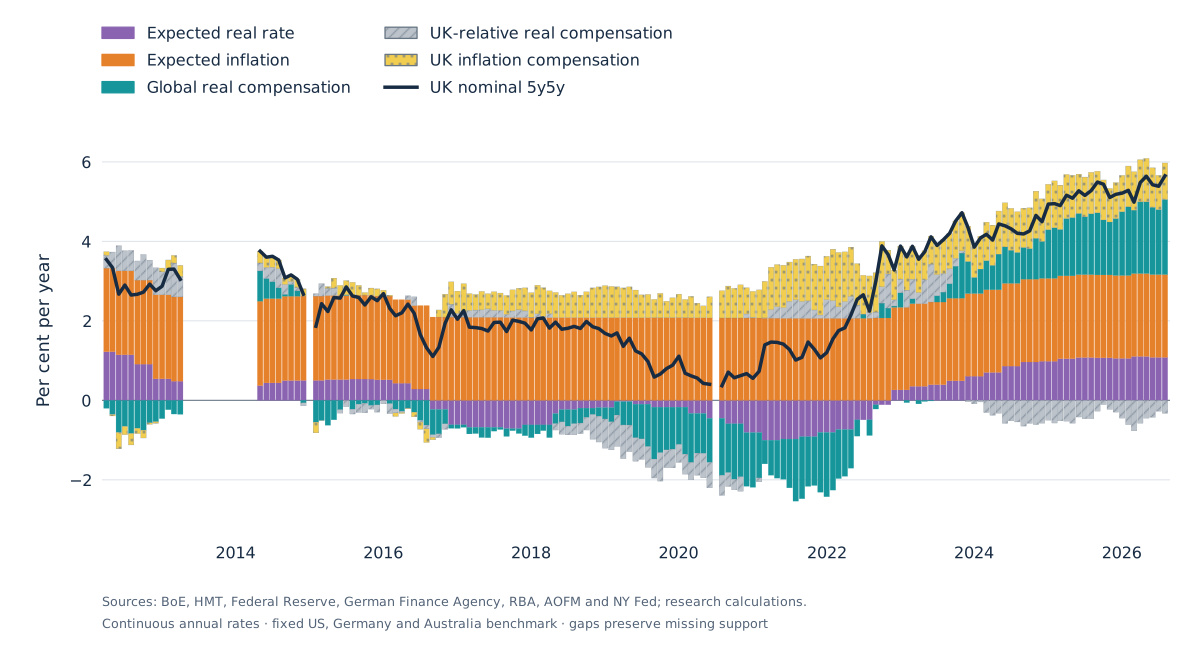
We divide that rate into expected real rates, expected inflation, global real compensation, UK-relative real compensation and UK inflation compensation. The global component uses the US, Germany and Australia, with the UK excluded. Chart 1 shows the actual forward rate and the levels of its five components. Their sum is the dark line.
Chart 1. A global component in the UK forward rate
Global real compensation explains most of the rise since 2019
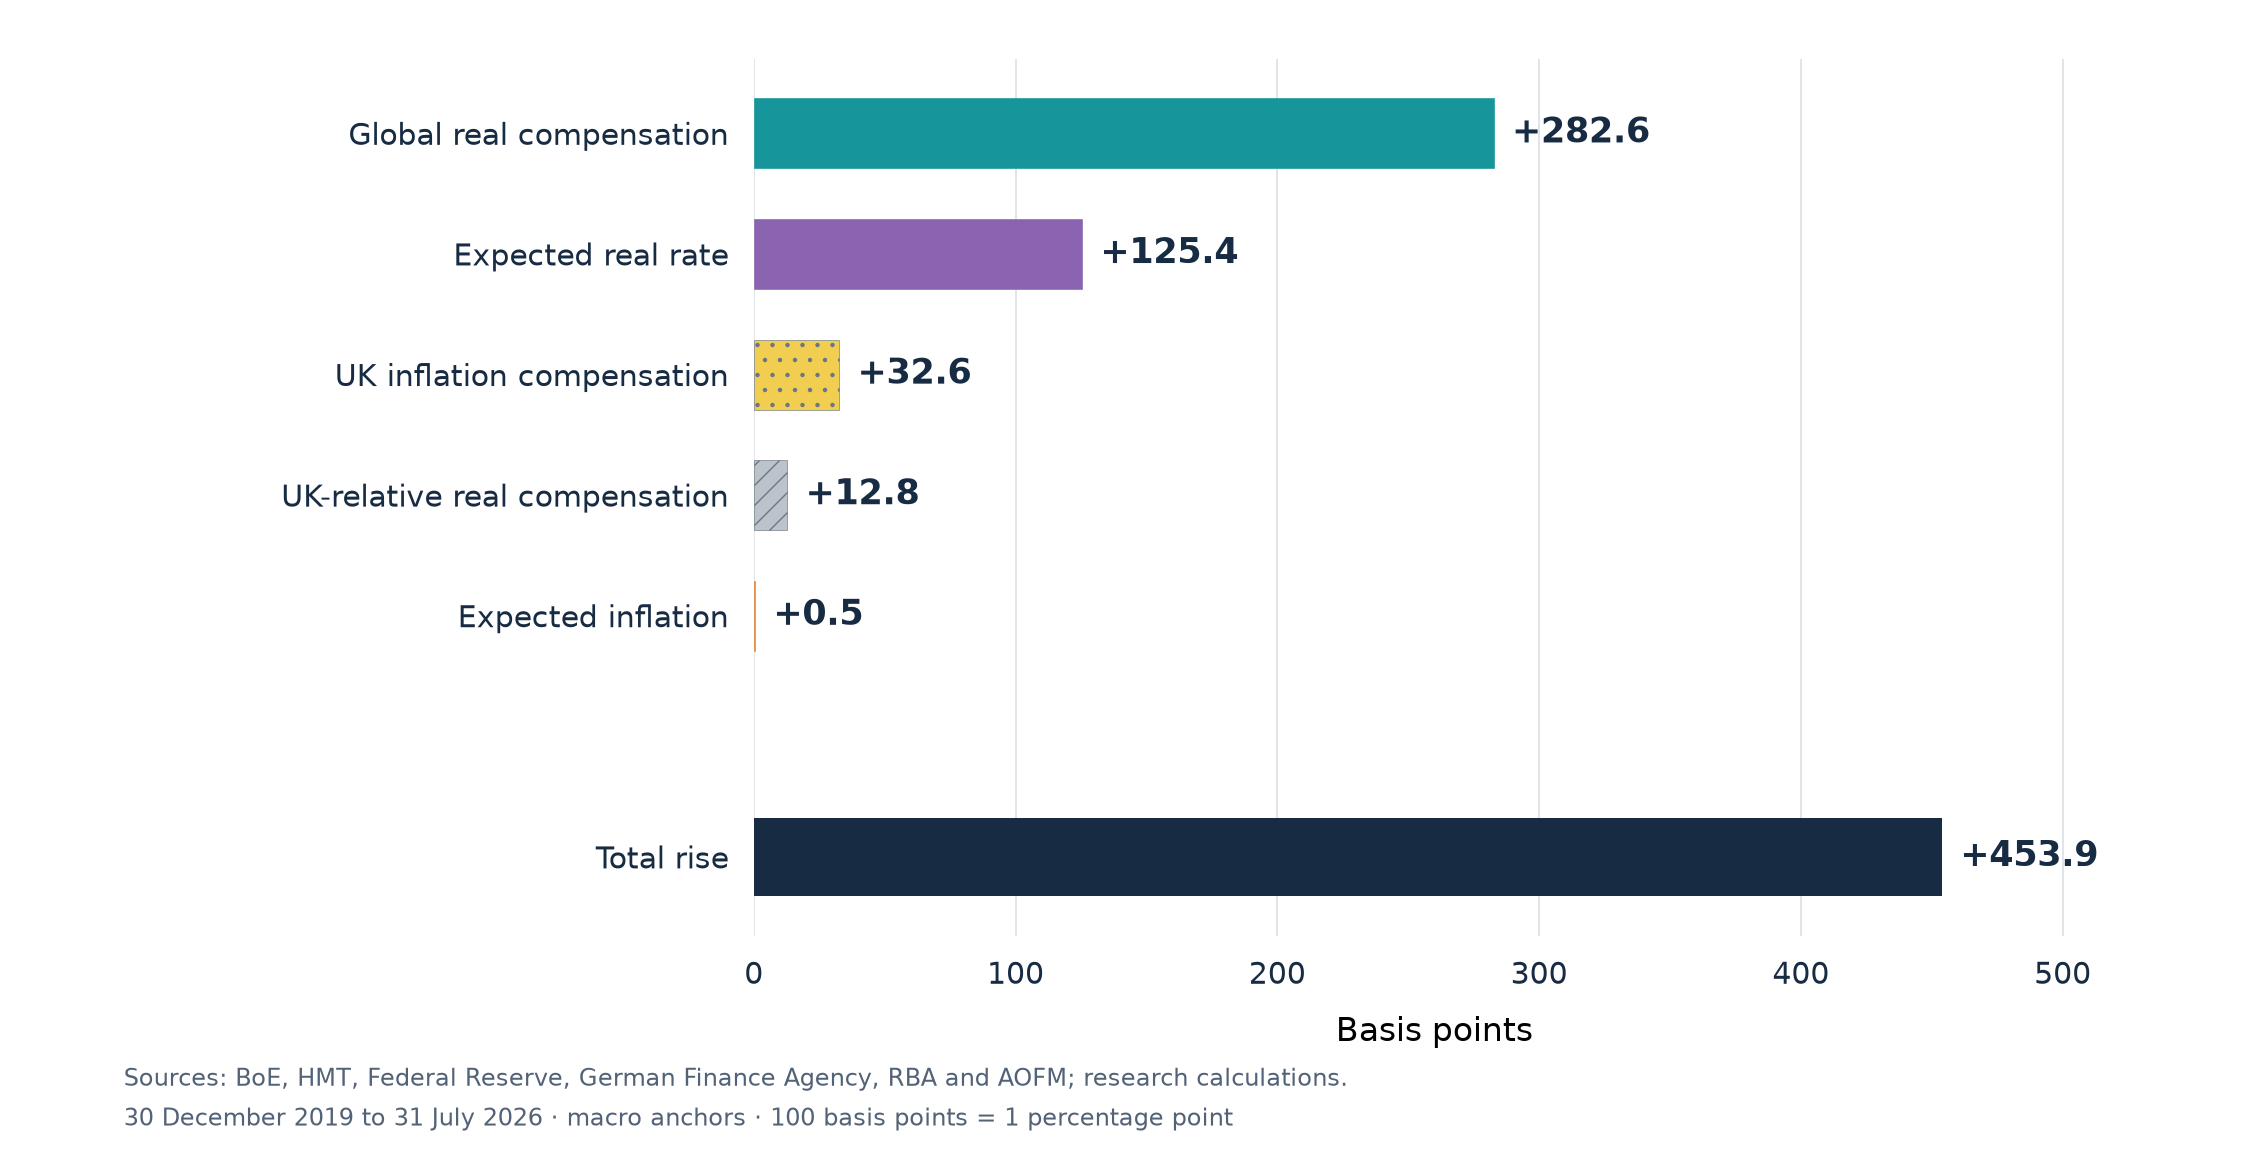
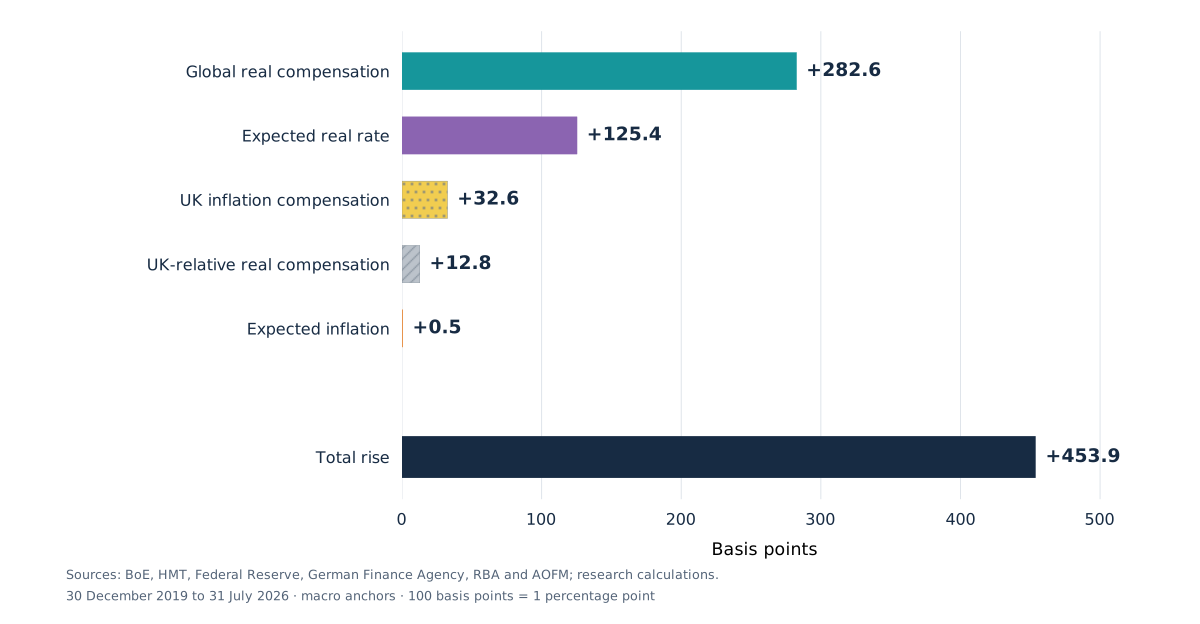
In the longer three-country model, global real compensation accounts for about 2.83 percentage points of the 4.54-point increase in the UK forward rate since the end of 2019. Higher expected UK real rates contribute another 1.25 points. Inflation compensation adds around 0.33 points, and the UK-relative real component around 0.13 points. These are changes between two daily endpoints in the reference specification. Expected inflation changes very little in this reference estimate.
Chart 2. The rise since 2019 has come mainly from the real side
This is consistent with a world in which capital has become more expensive. Investment in artificial intelligence, energy systems and defence could increase financing needs. Greater public borrowing could add to the competition for investors’ balance sheets. These pressures can influence both the expected path of real interest rates and the compensation required to commit money for longer.
If investment opportunities improve, expected real rates may rise. If investors become less willing to absorb interest-rate risk, real compensation may rise instead. A retreat from central-bank bond purchases, more duration supplied to the market, or changes in pension demand could all contribute to the latter. Our decomposition points to a sizeable role for compensation, alongside higher expected real rates. It leaves the causal shares of those explanations open.
Inflation expectations and inflation risk can move differently
Across alternative expectations estimates and adjustments for the inflation index, the average inflation compensation is about 34–49 basis points higher in 2017–19 than in 2013–15. It is around 38–67 basis points higher in the second quarter of 2026 than in the final quarter of 2019. This uses quarter averages across the expectation and market-conversion menu; it is a different comparison from the 33 bp daily-endpoint change in Chart 2. One basis point is 0.01 percentage points.
The timing makes Brexit an obvious part of the debate. Exchange-rate exposure, supply constraints and the policy response to inflation shocks are plausible channels. But the longer history also shows sizeable inflation compensation around 2008–11. Elevated compensation has appeared under more than one economic regime.
Chart 3. Inflation compensation is elevated but has not risen steadily
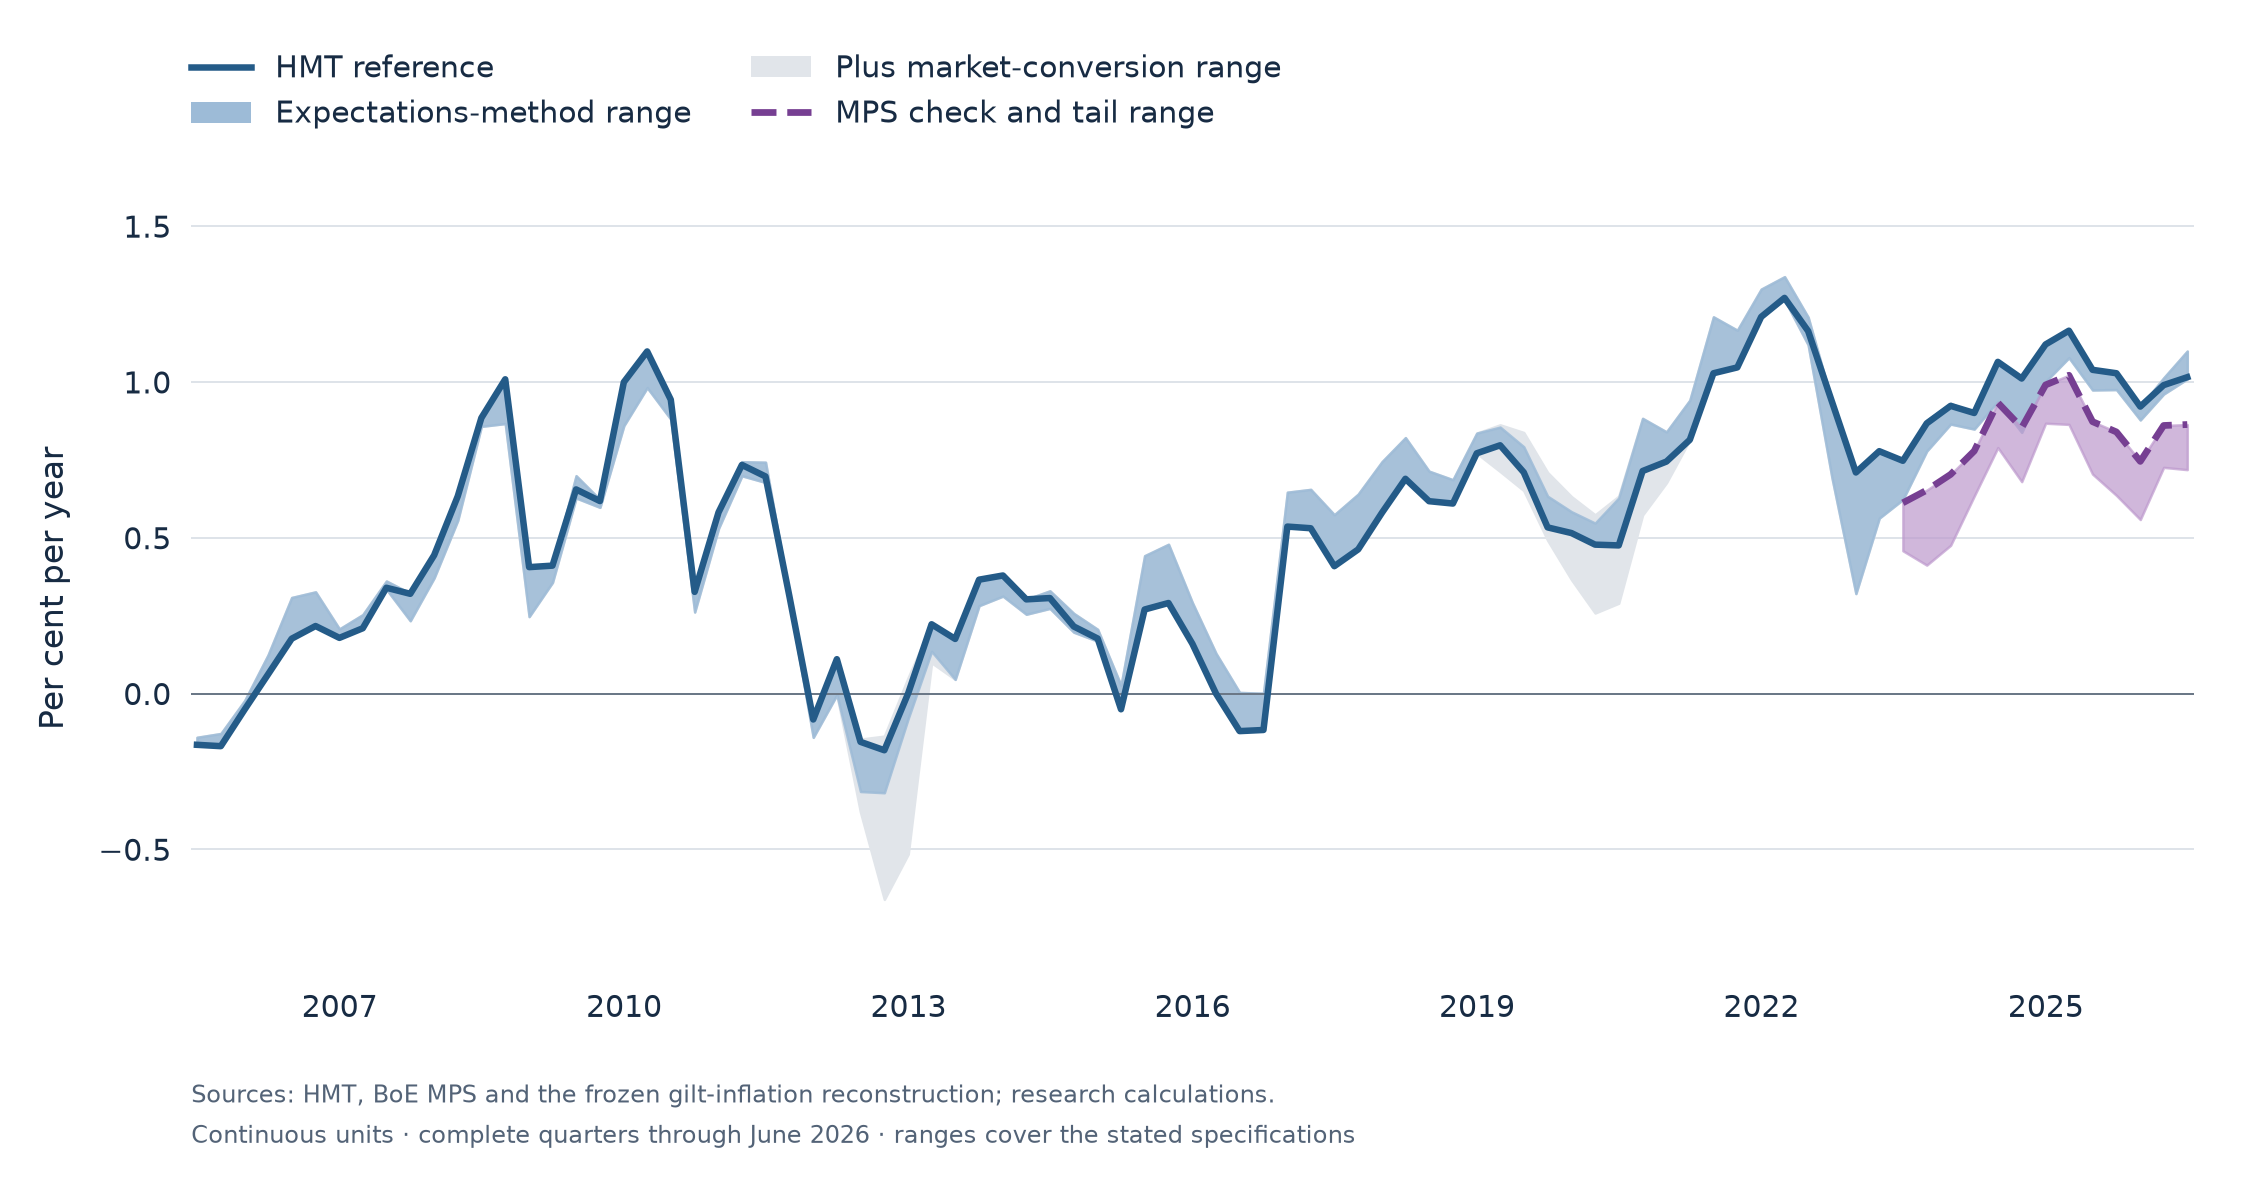
Could this simply be a story of higher expected inflation? The Bank’s Market Participants Survey asks directly about average inflation between five and ten years ahead. The survey-implied mean is about 2.25% at both its March 2023 and June 2026 endpoints, although it moves between them. The July market comparisons carry forward the June survey distribution, which is 42 days old at month end. Using that measure, estimated inflation compensation rises by about 25–26 basis points between the second quarters of 2023 and 2026.
Investors can expect inflation to return close to target while still demanding a higher price for exposure to it. Inflation that arrives when growth is weak can be particularly damaging to a nominal bondholder. Higher compensation may therefore reflect the cost of an adverse outcome as well as its probability. Indeed, the survey probability assigned to average inflation above 3% falls from 8.8% to 6.8% between those releases.
The recent path is also more varied than a simple deterioration in confidence would suggest. Both survey approaches indicate a fall in inflation compensation during 2025, followed by a partial rebound in the first half of 2026. The level is elevated; the direction is not consistently upwards.
The UK-relative estimate depends on the specification
In the recent crosscheck using survey anchors for the three foreign markets, global real compensation is about 1.93 percentage points and the UK-relative adjustment is minus 0.37 points. The corresponding long-history macro estimates are 1.887 and minus 0.323 points. Across selected same-date survey variants, UK-relative compensation ranges from minus 1.337 to plus 0.597 points, so its sign is sensitive to the assumptions. Each reference pair sums to about 1.56 points of total UK real compensation. The negative relative adjustment places the UK below that benchmark; total UK real compensation remains positive.
The reference estimates do not show a large additional UK real surcharge. Their sensitivity leaves a demanding fiscal question. Governments compete for the same pool of capital, and a shared repricing of sovereign borrowing need not produce a large UK spread. Fiscal concerns can also affect inflation compensation. The Exchequer pays the higher financing cost whatever its geographical origin.
Interpreting the composition of yields
For monetary policy, higher global real compensation already tightens financial conditions. An increase in the inflation compensation raises a separate question: how much confidence do investors have in the policy response when the next difficult inflation shock arrives? Stable average forecasts provide some reassurance, but they do not settle that question.
One interpretation is that a credible willingness to contain persistent inflation could lower the compensation investors demand, even without much movement in their central forecast. Another is that global risk pricing and changing demand for bonds explain much of the compensation. Those interpretations imply different responses, which is why the composition of the forward rate is useful.
These reference estimates show that the UK is borrowing in a more expensive global real-rate environment, with an additional inflation-related cost. The debate is how much of that cost can be reduced by domestic policy, and how much reflects the terms on which investors now supply capital to governments everywhere.
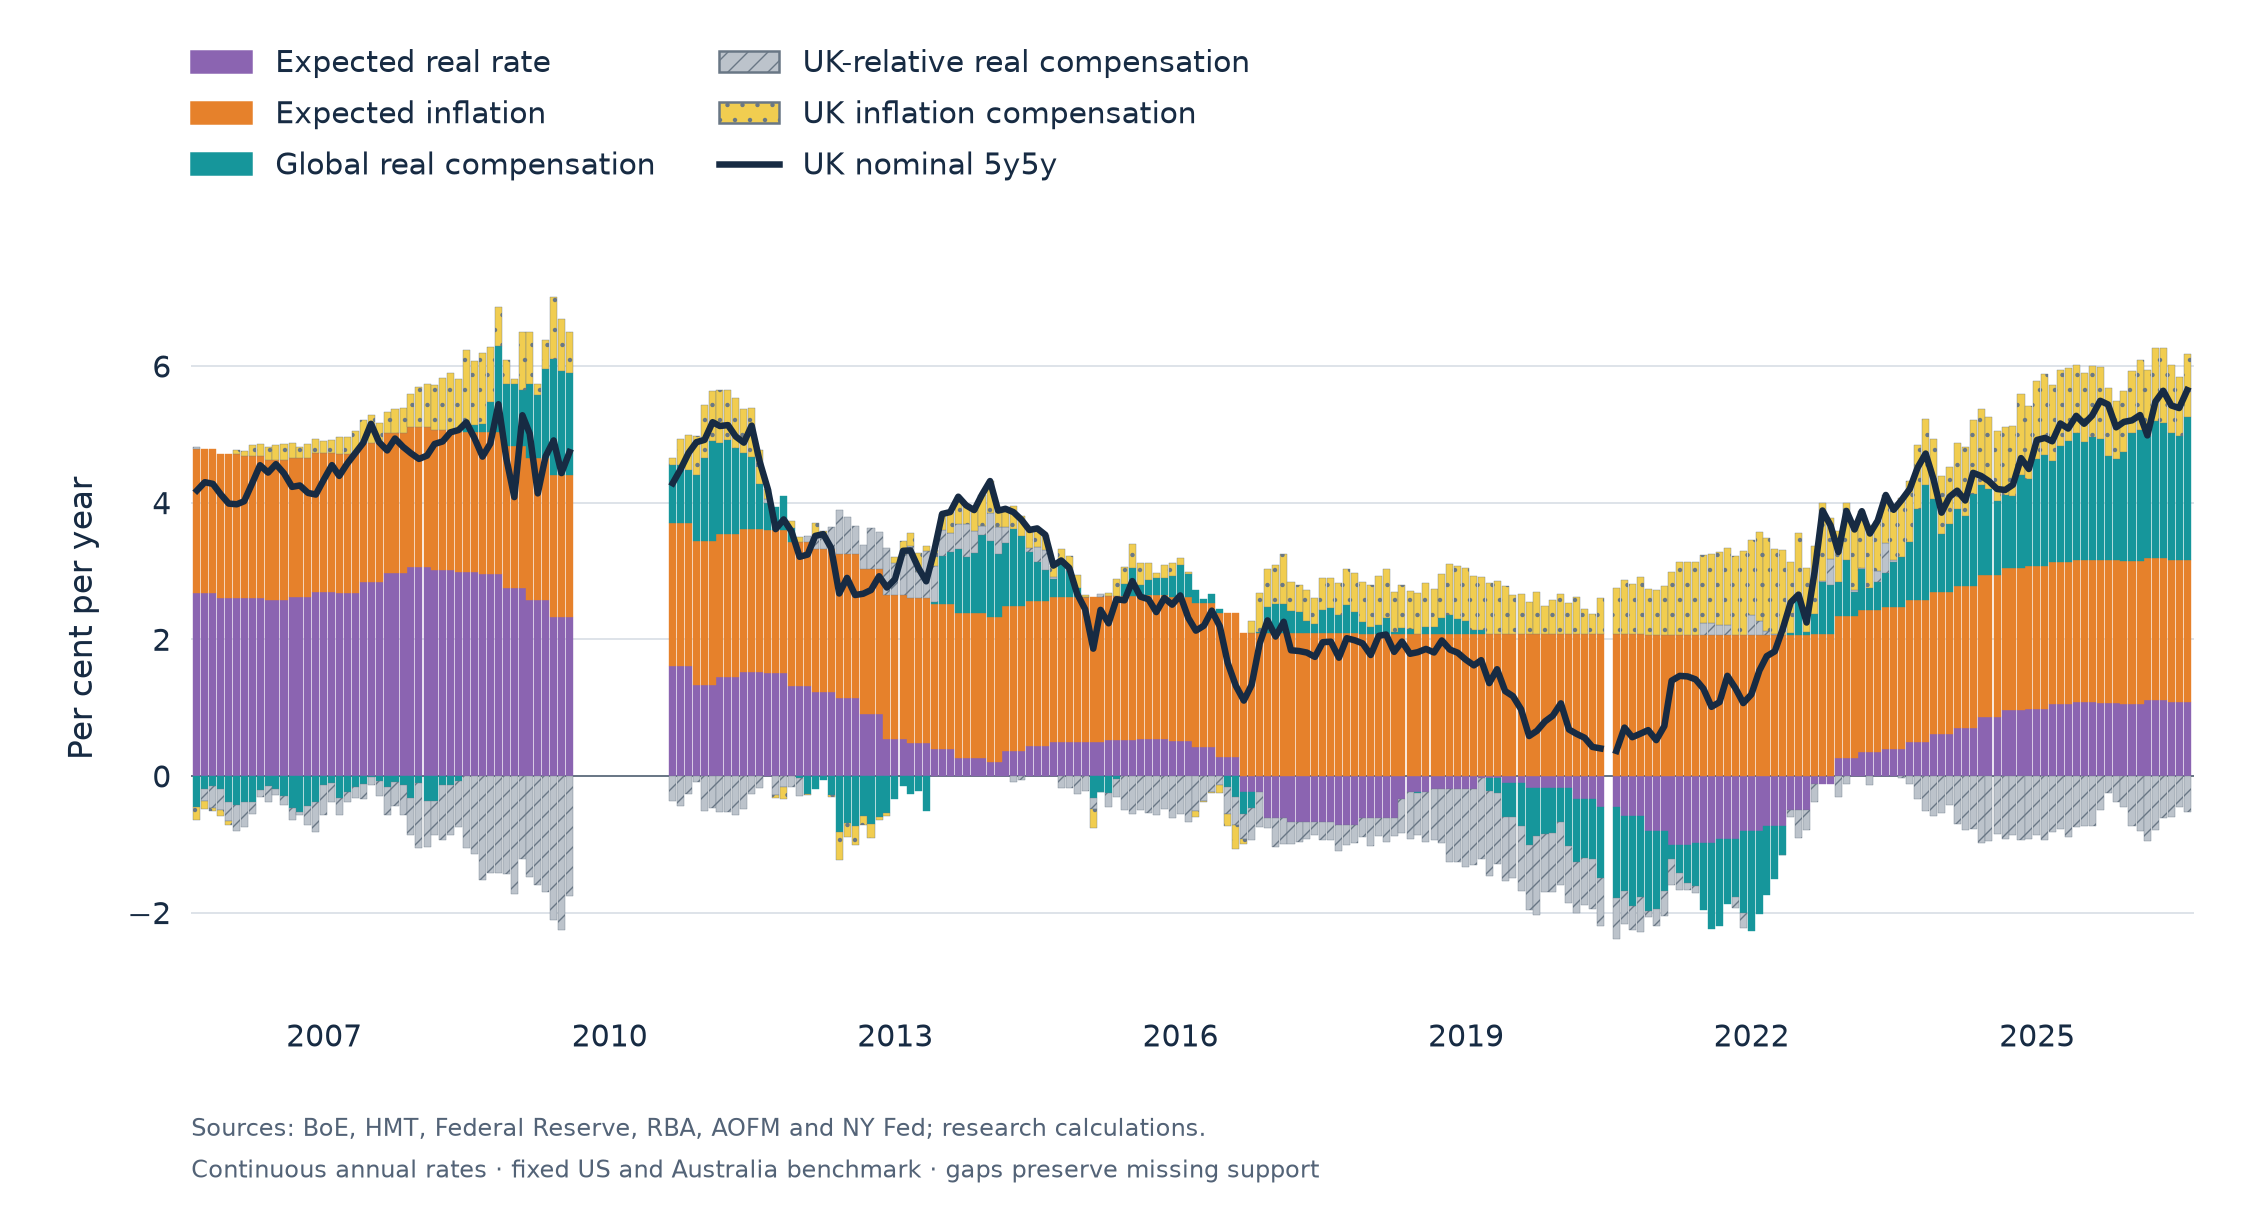
The longer historical perspective
A fixed US and Australian benchmark extends the complete five-part history back to August 2005. It places the recent rise alongside the pre-crisis period and the subsequent years of exceptionally low real rates. The broader three-country series remains the main comparison from 2012 onwards. A disturbance that raises foreign real compensation, such as reduced market liquidity, raises the global bar and lowers the UK-relative bar by the same amount if UK inputs are unchanged. Large negative UK-relative readings around the financial crisis therefore need not originate in UK conditions.
Chart 4. The five-component history extends back to 2005
A note on the estimates
Rate levels in the decomposition and charts are continuously compounded; the quoted survey means use annual inflation rates. Market data end on 31 July 2026; complete-quarter comparisons end in June. The long history uses independent HMT terminal-year forecasts as imperfect anchors for UK expectations in years 5–10, and macro neutral-rate estimates for the foreign real-rate anchors. The recent MPS comparison uses published probability distributions with explicit assumptions about the open tails. The historical inflation reference has a fitted zero innovation variance under assumed 25 bp survey noise; filtered expectations therefore become an expanding average of earlier forecasts. The inflation conclusions are also checked against more responsive estimates.
UK inflation compensation is translated from RPI-linked gilts into a CPIH-equivalent measure and compared with CPI survey expectations. The three compensation components in the five-part decomposition are the amounts left after subtracting the stated expectations. The broader market inflation-compensation input includes expected inflation; subtracting the survey expectation produces the fifth component. Liquidity, index differences and common international inflation risks can also enter these components. The charts are a decomposition, not causal estimates of Brexit, fiscal credibility or investment spending; a changing index or horizon gap could alter the estimated inflation-compensation trend. Germany has one-third of the three-market benchmark, and its real curve is sparse: at the latest date the ten-year point lies between bonds about 6.7 and 19.7 years away. Changing the interpolation shifts German real 5y5y by about 21.5 bp and the three-market benchmark by 7.2 bp.
The underlying five components reconcile to the observed nominal rate. The research includes alternative expectation and market-conversion assumptions, a methods and results note and an evidence ledger.