Charts & data

Published · Research checkpoint
Market data through

Chart book

The five-component history, its global benchmark and the inflation evidence, in one consistent set of charts.

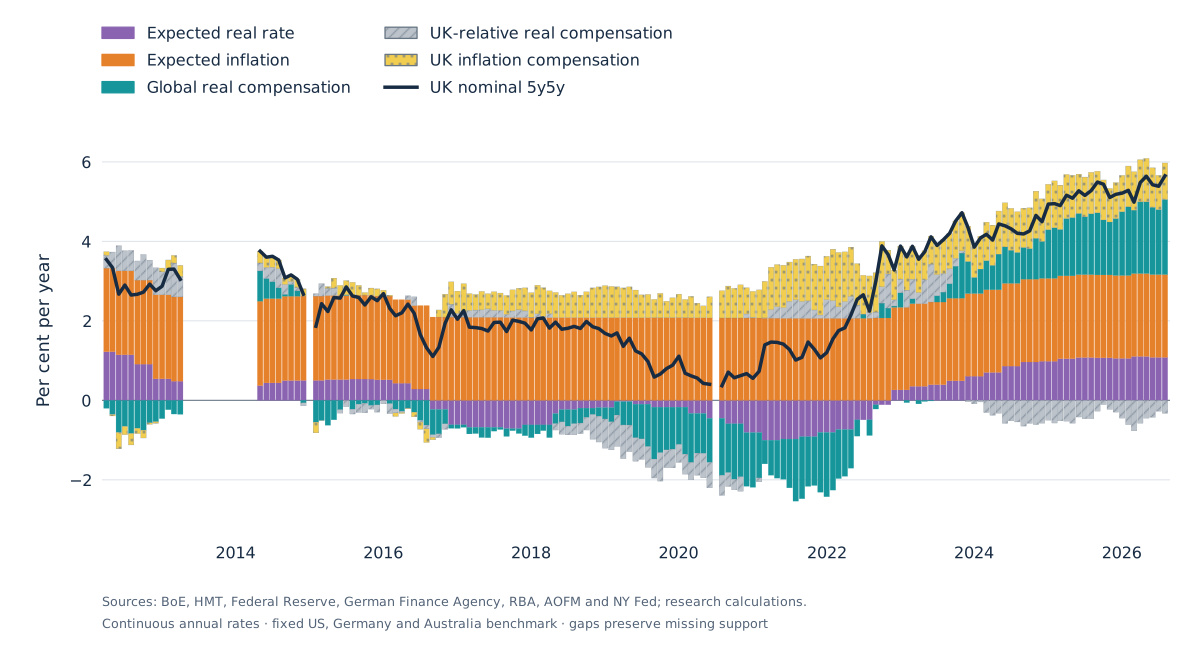
Chart 1. A global component in the UK forward rate
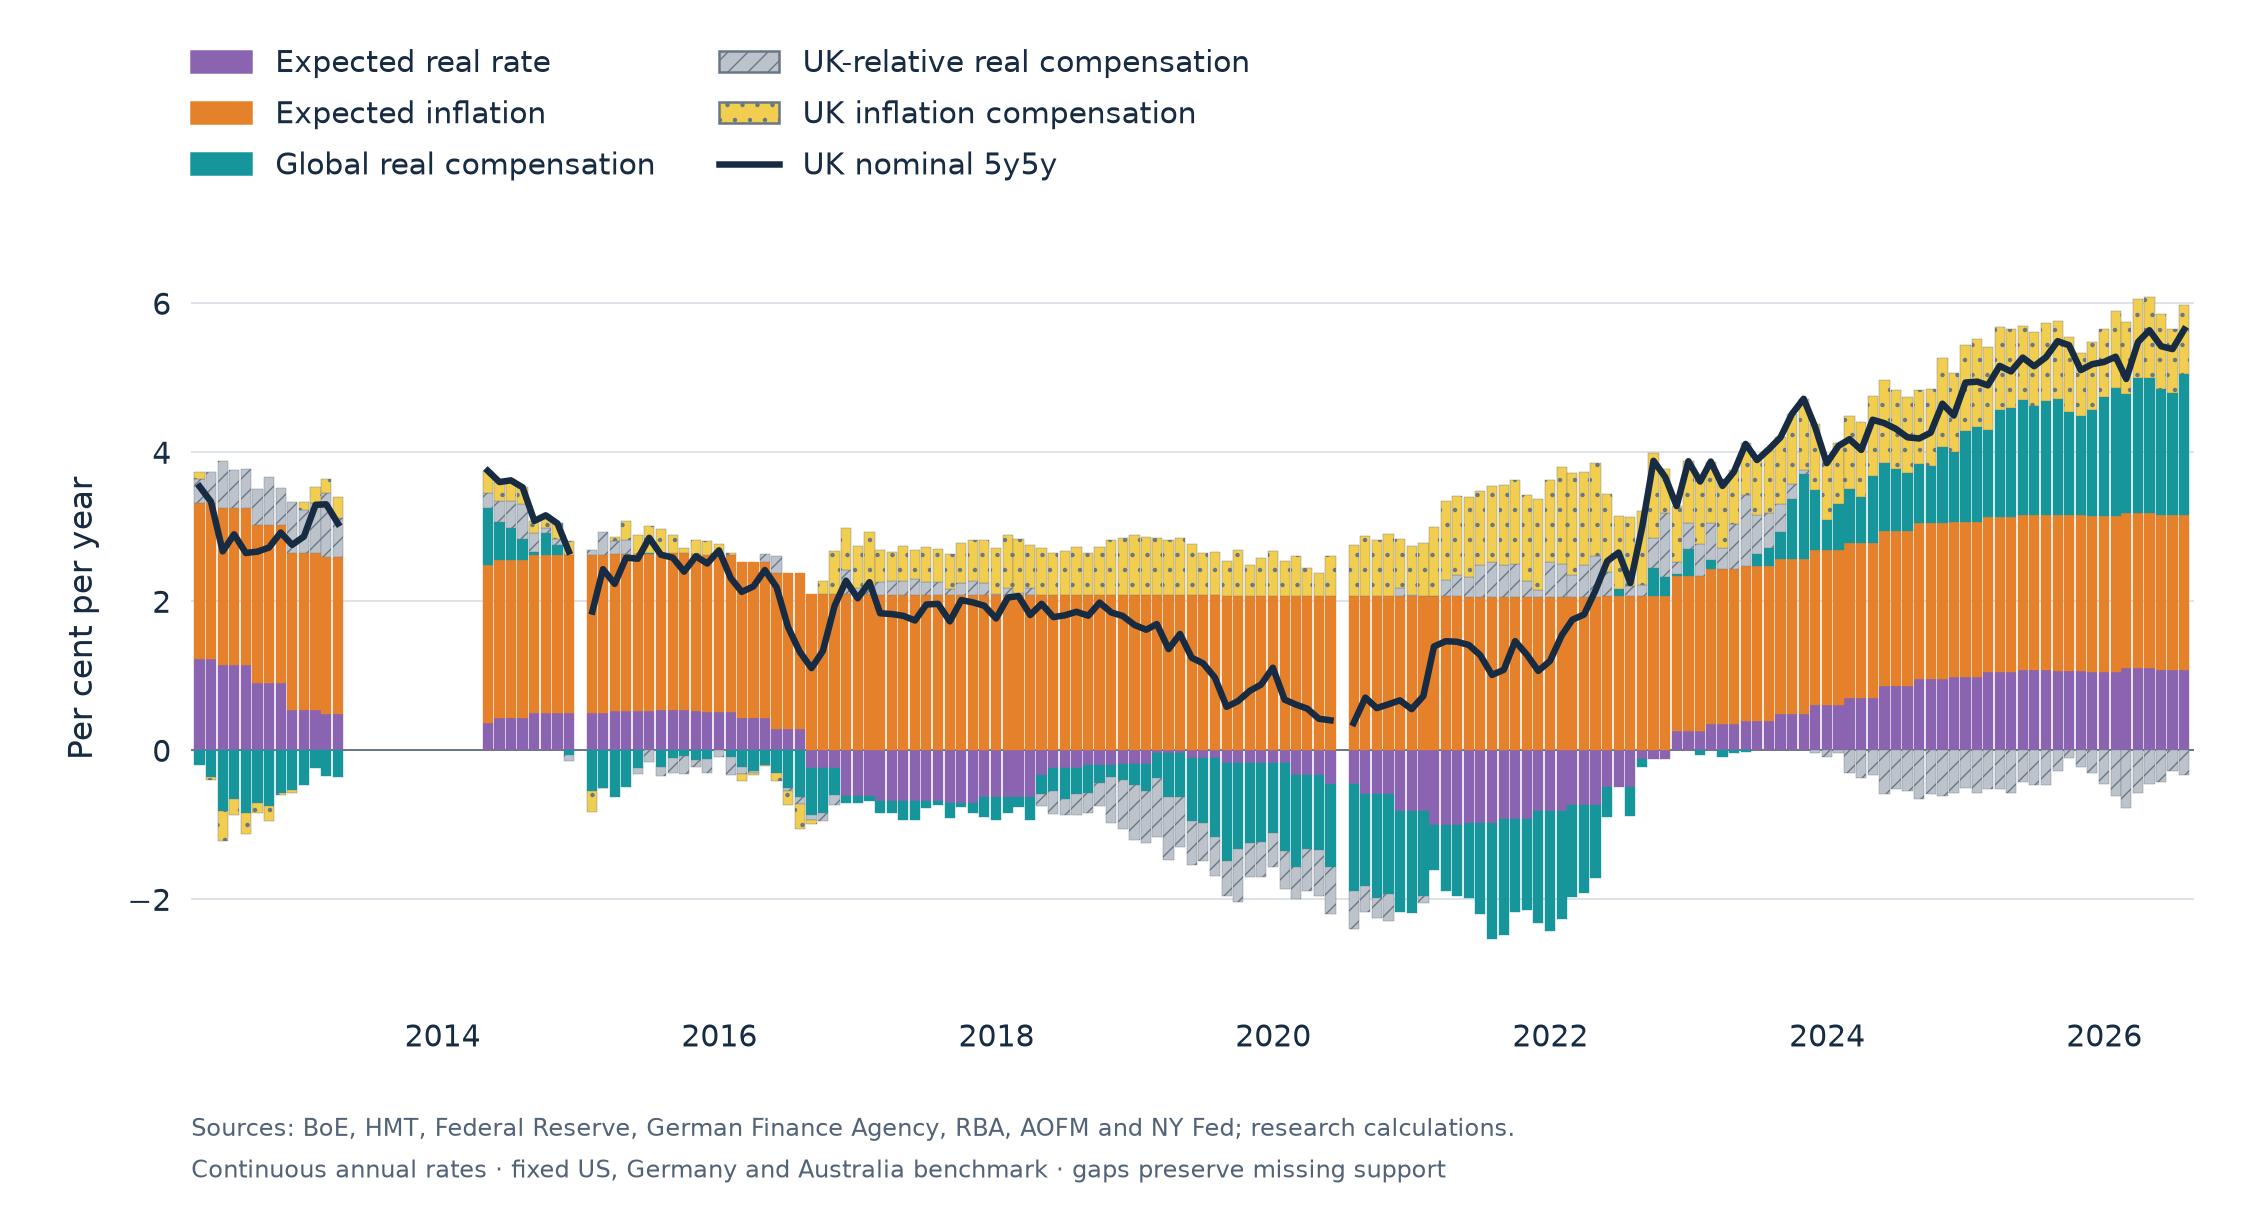
Monthly UK nominal 5y5y and five components from March 2012 to July 2026, using a fixed US, German and Australian macro benchmark. Unsupported months remain blank.
Monthly levels, March 2012 to July 2026. Fixed equal-weight US, German and Australian benchmark with macro neutral-rate anchors. Missing market-support months remain gaps. Sources: public central-bank, survey and market datasets; research calculations. Compensation is measured relative to the expectation anchors in the methods note. The April 2013–March 2014 gap reflects missing German ten-year real-curve support. December 2014 fails the common-date month-end rule; June 2020 lacks Australian five-year support.

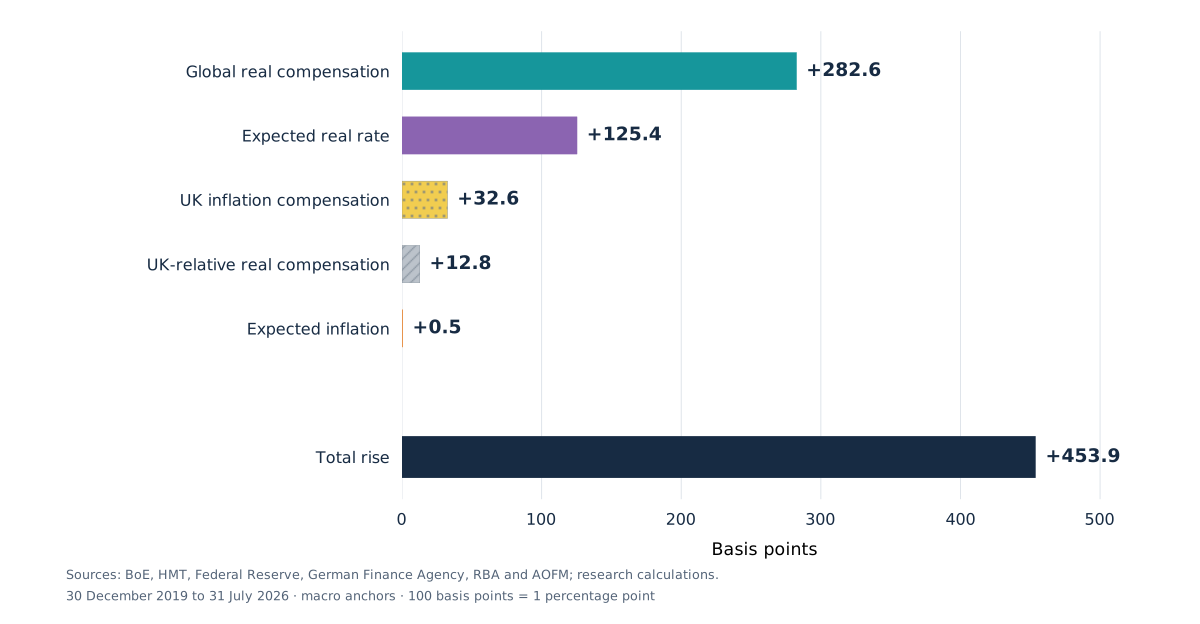
Chart 2. The rise since 2019 has come mainly from the real side
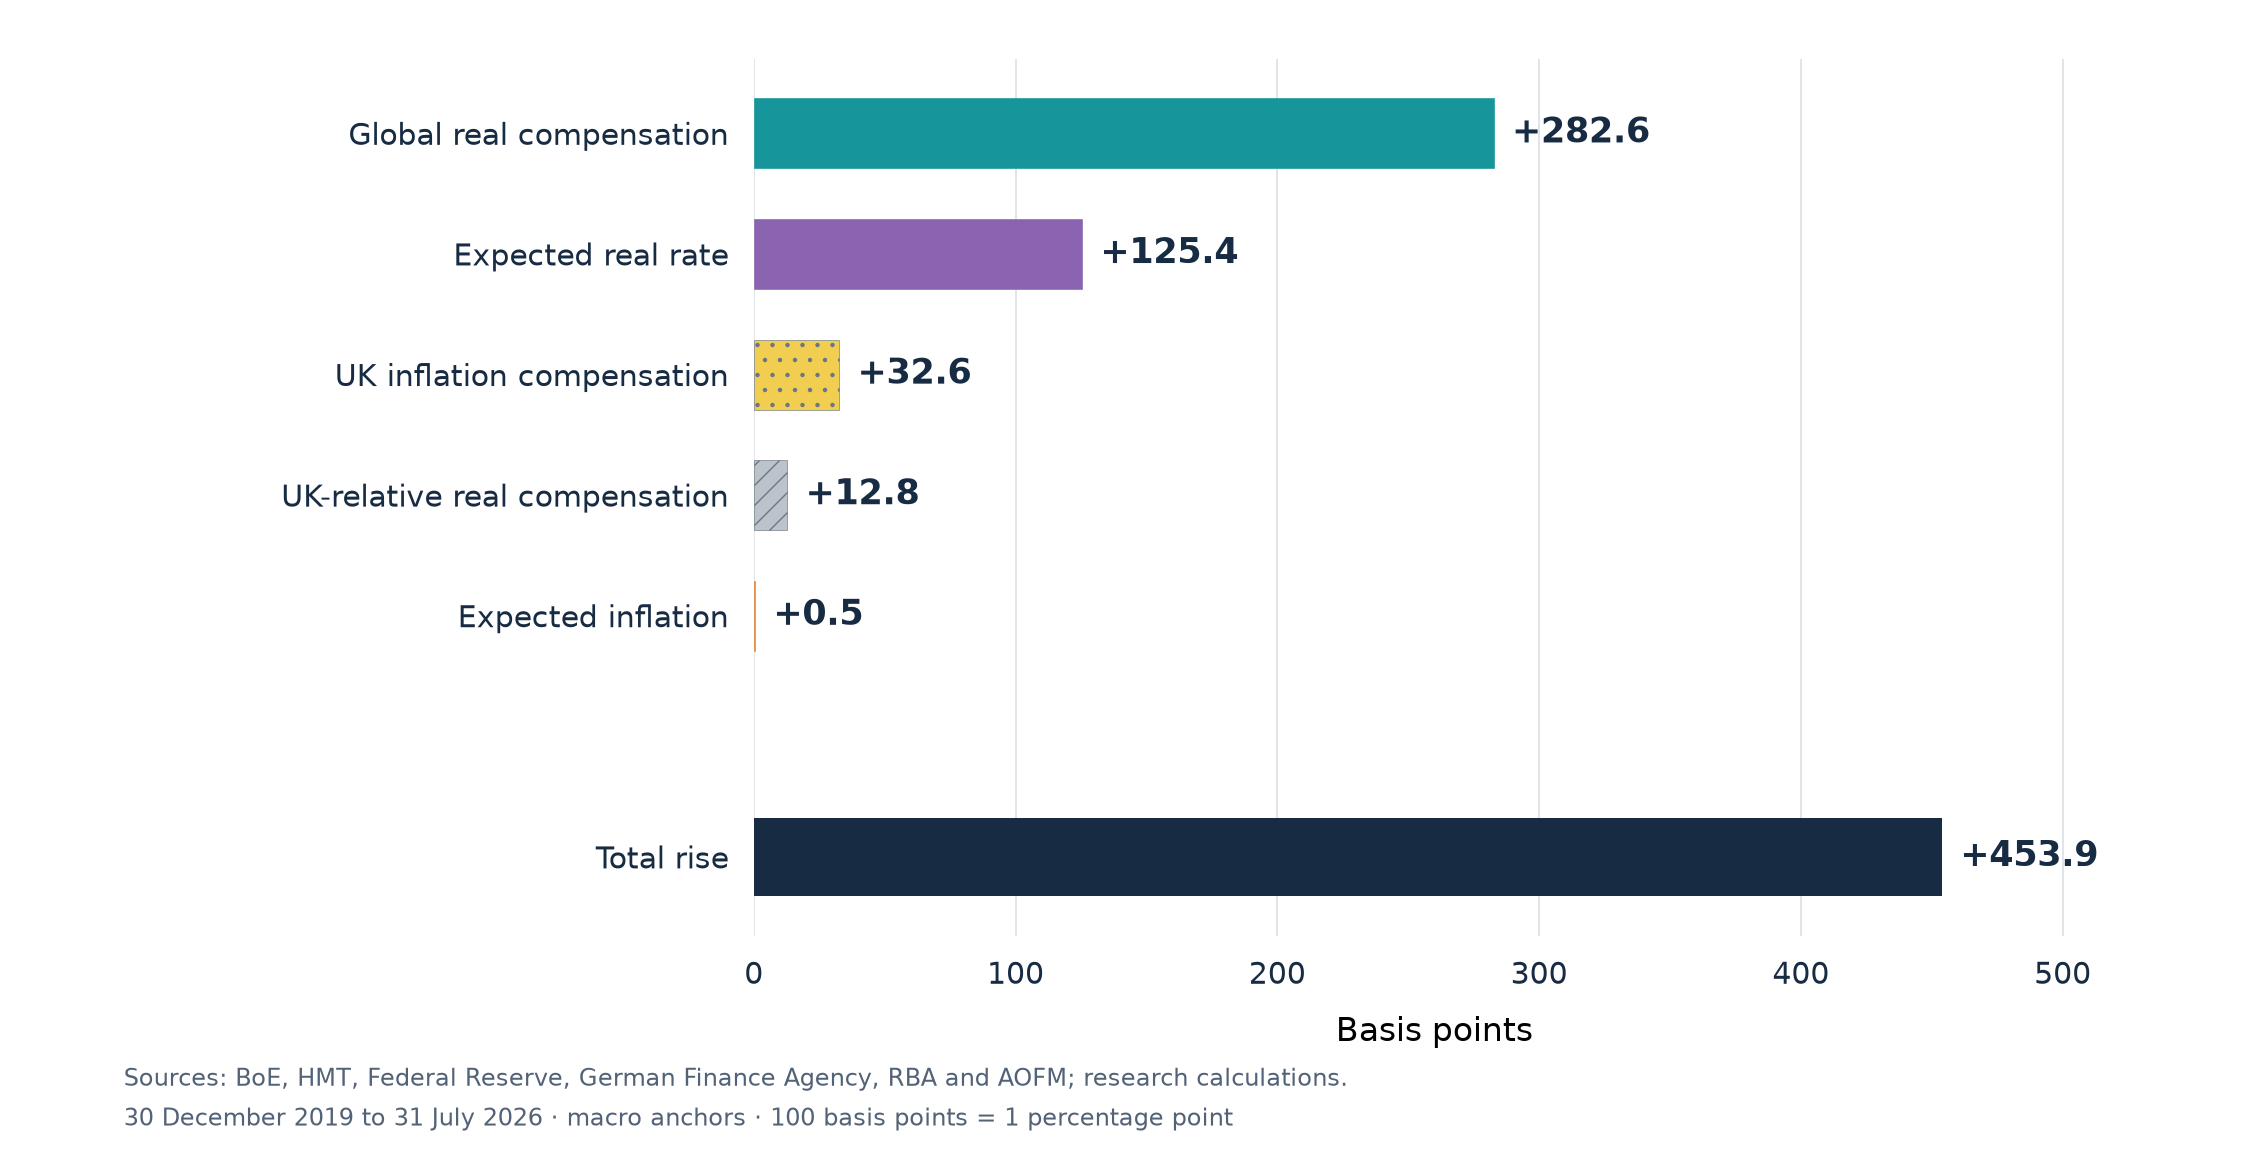
Contributions to the 453.9 basis point rise: global real compensation 282.6, expected real rate 125.4, inflation compensation 32.6, UK-relative real compensation 12.8 and expected inflation 0.5.
Change from 30 December 2019, the last common observation that year, to 31 July 2026. Basis points; 100 basis points equal one percentage point. Model allocations sum to the 4.54-point rise in the nominal forward rate. Source: three-country historical decomposition; research calculations. The near-zero expected-inflation contribution reflects the fitted zero-innovation reference filter and its expanding-average updates. Alternative expectation paths are shown in Chart 5 of the chart book; the MPS check begins in 2023.

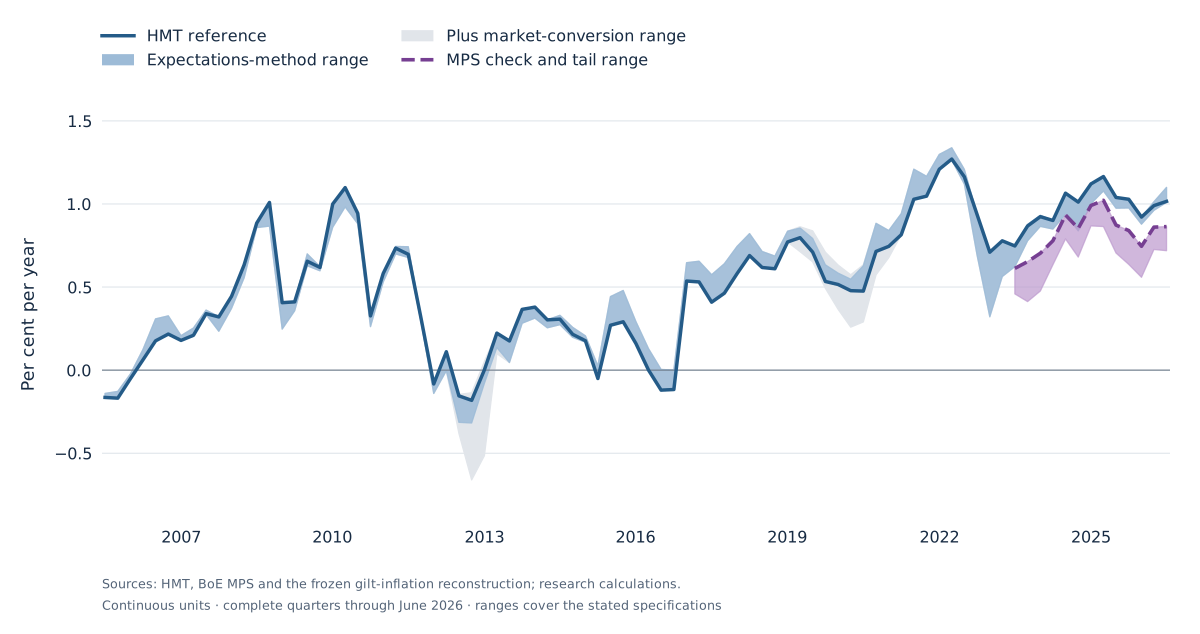
Chart 3. Inflation compensation is elevated but has not risen steadily
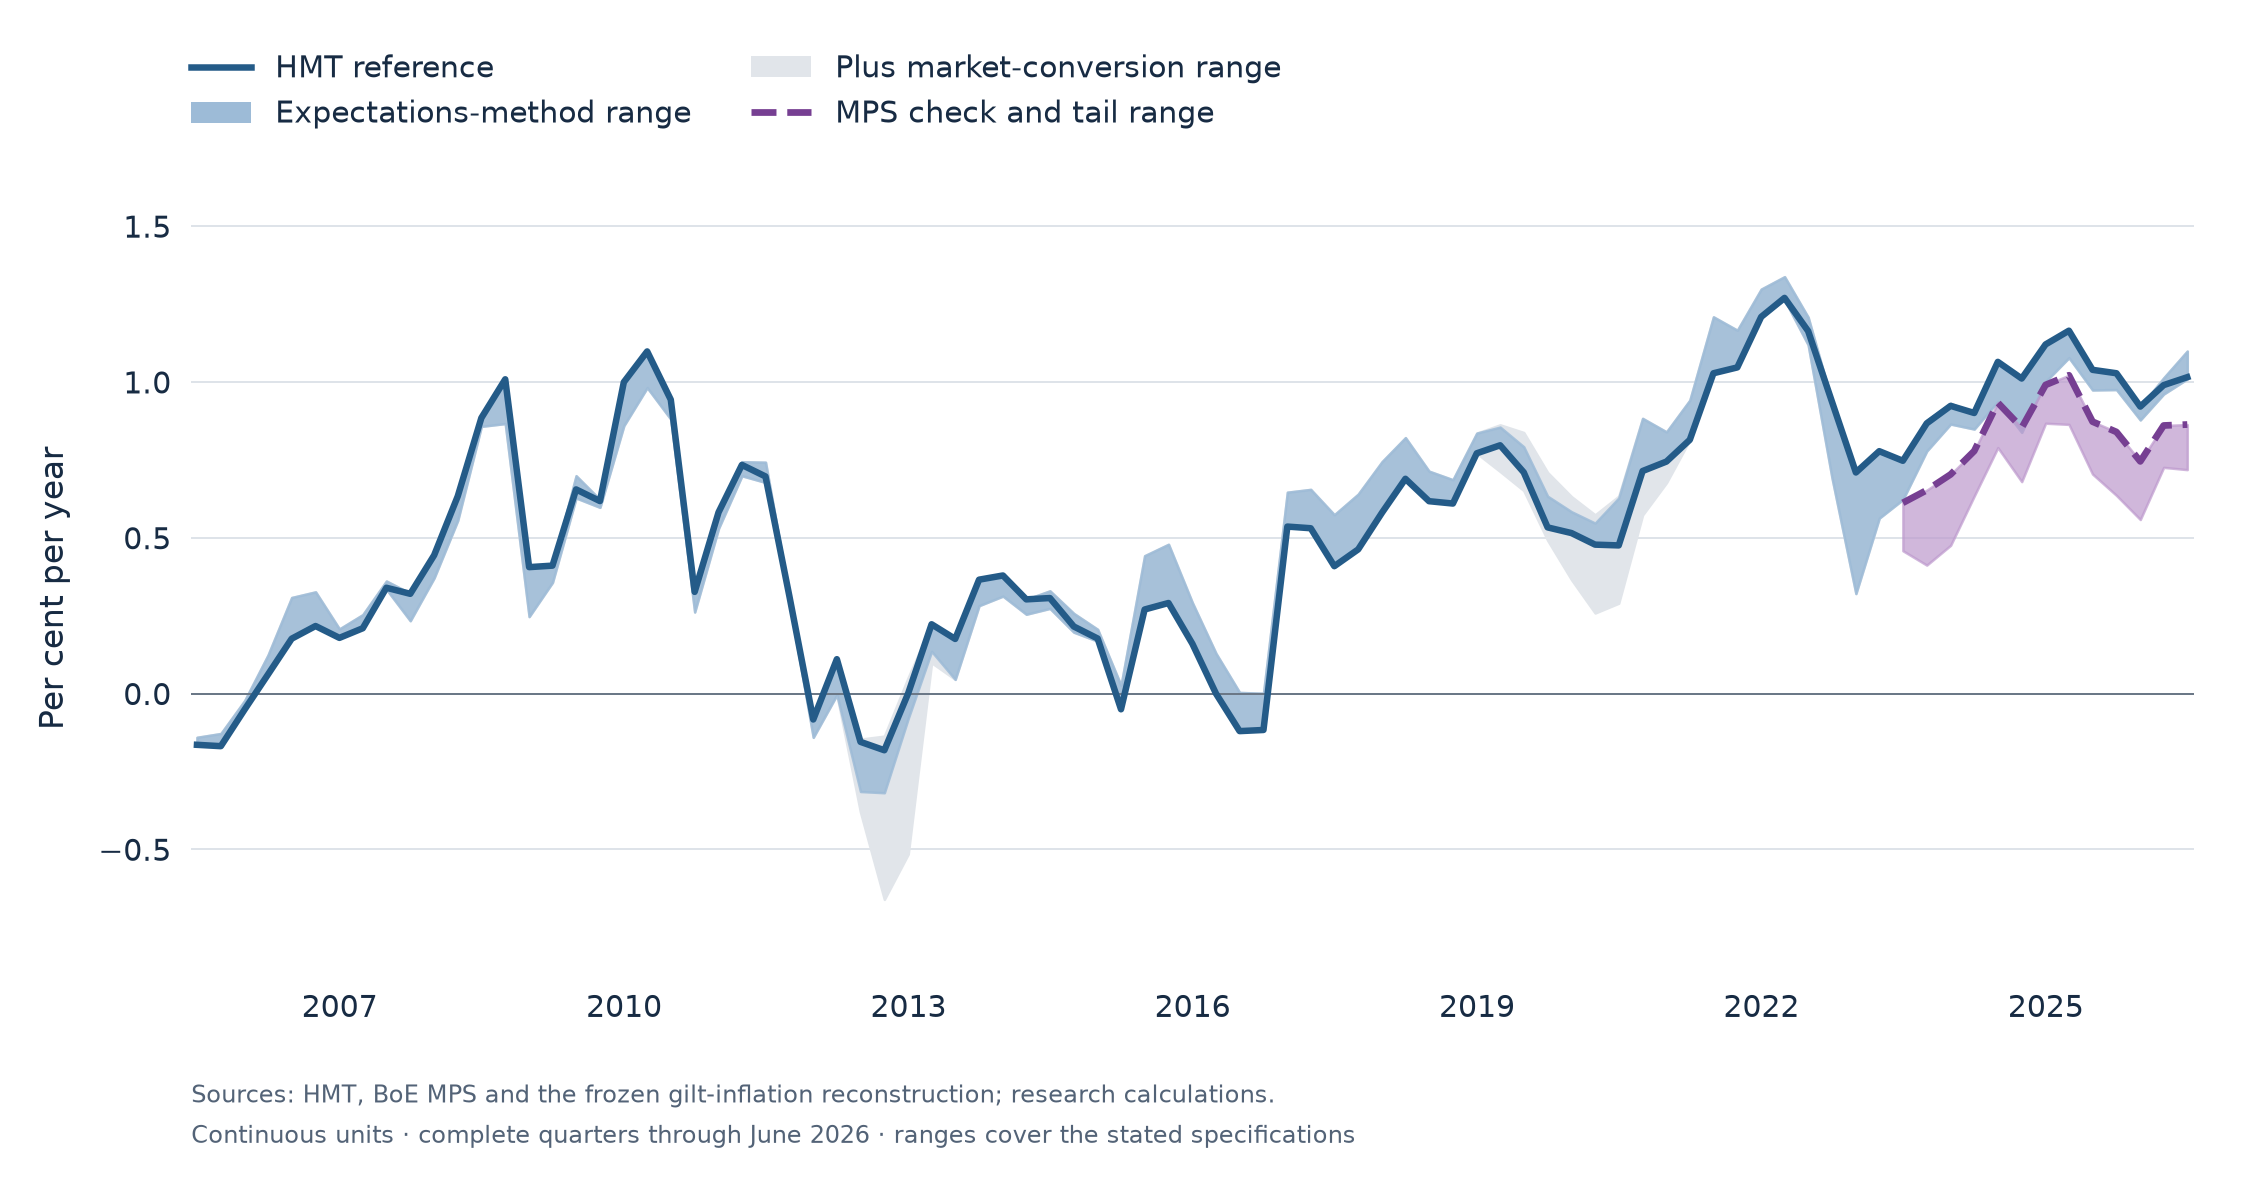
Quarterly UK inflation compensation since 2005, with HMT expectation and market-conversion ranges and a separate MPS comparison from 2023. The recent path falls in 2025 and partly rebounds in 2026.
Complete-quarter averages, 2005 Q2 to 2026 Q2. The long-history bands vary HMT expectations and CPIH market-conversion assumptions; the recent MPS band varies the treatment of the survey’s open tails. These are specification ranges, not confidence intervals. Sources: HMT independent forecasts, Bank of England Market Participants Survey and the market-inflation dataset; research calculations.

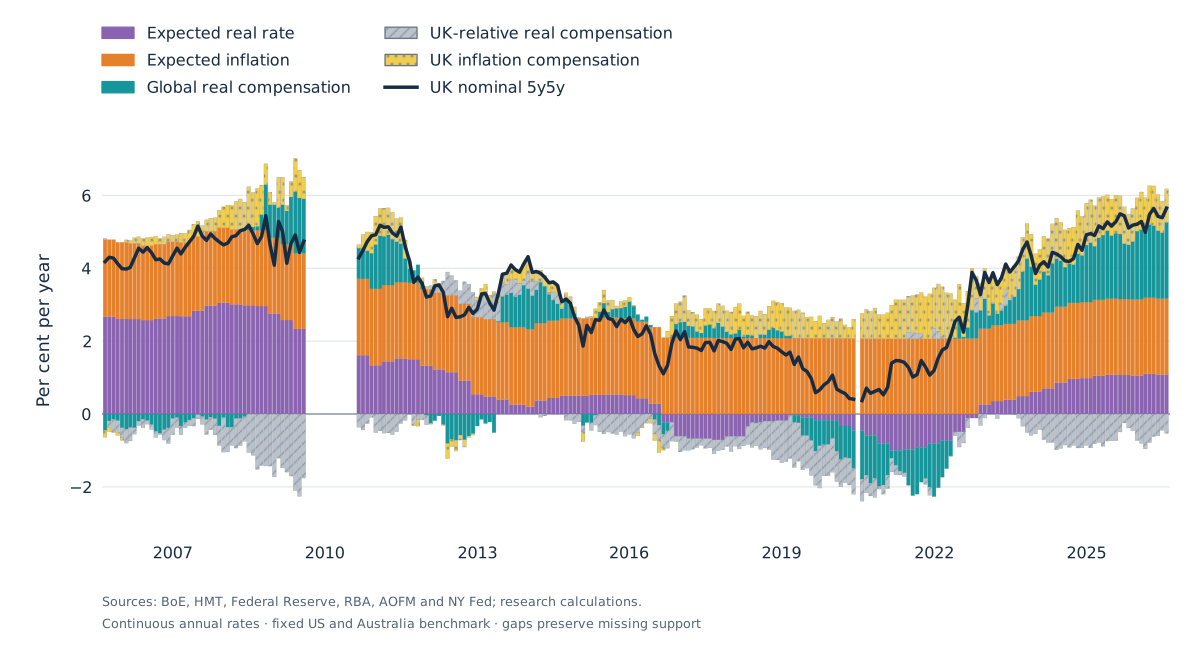
Chart 4. The five-component history extends back to 2005
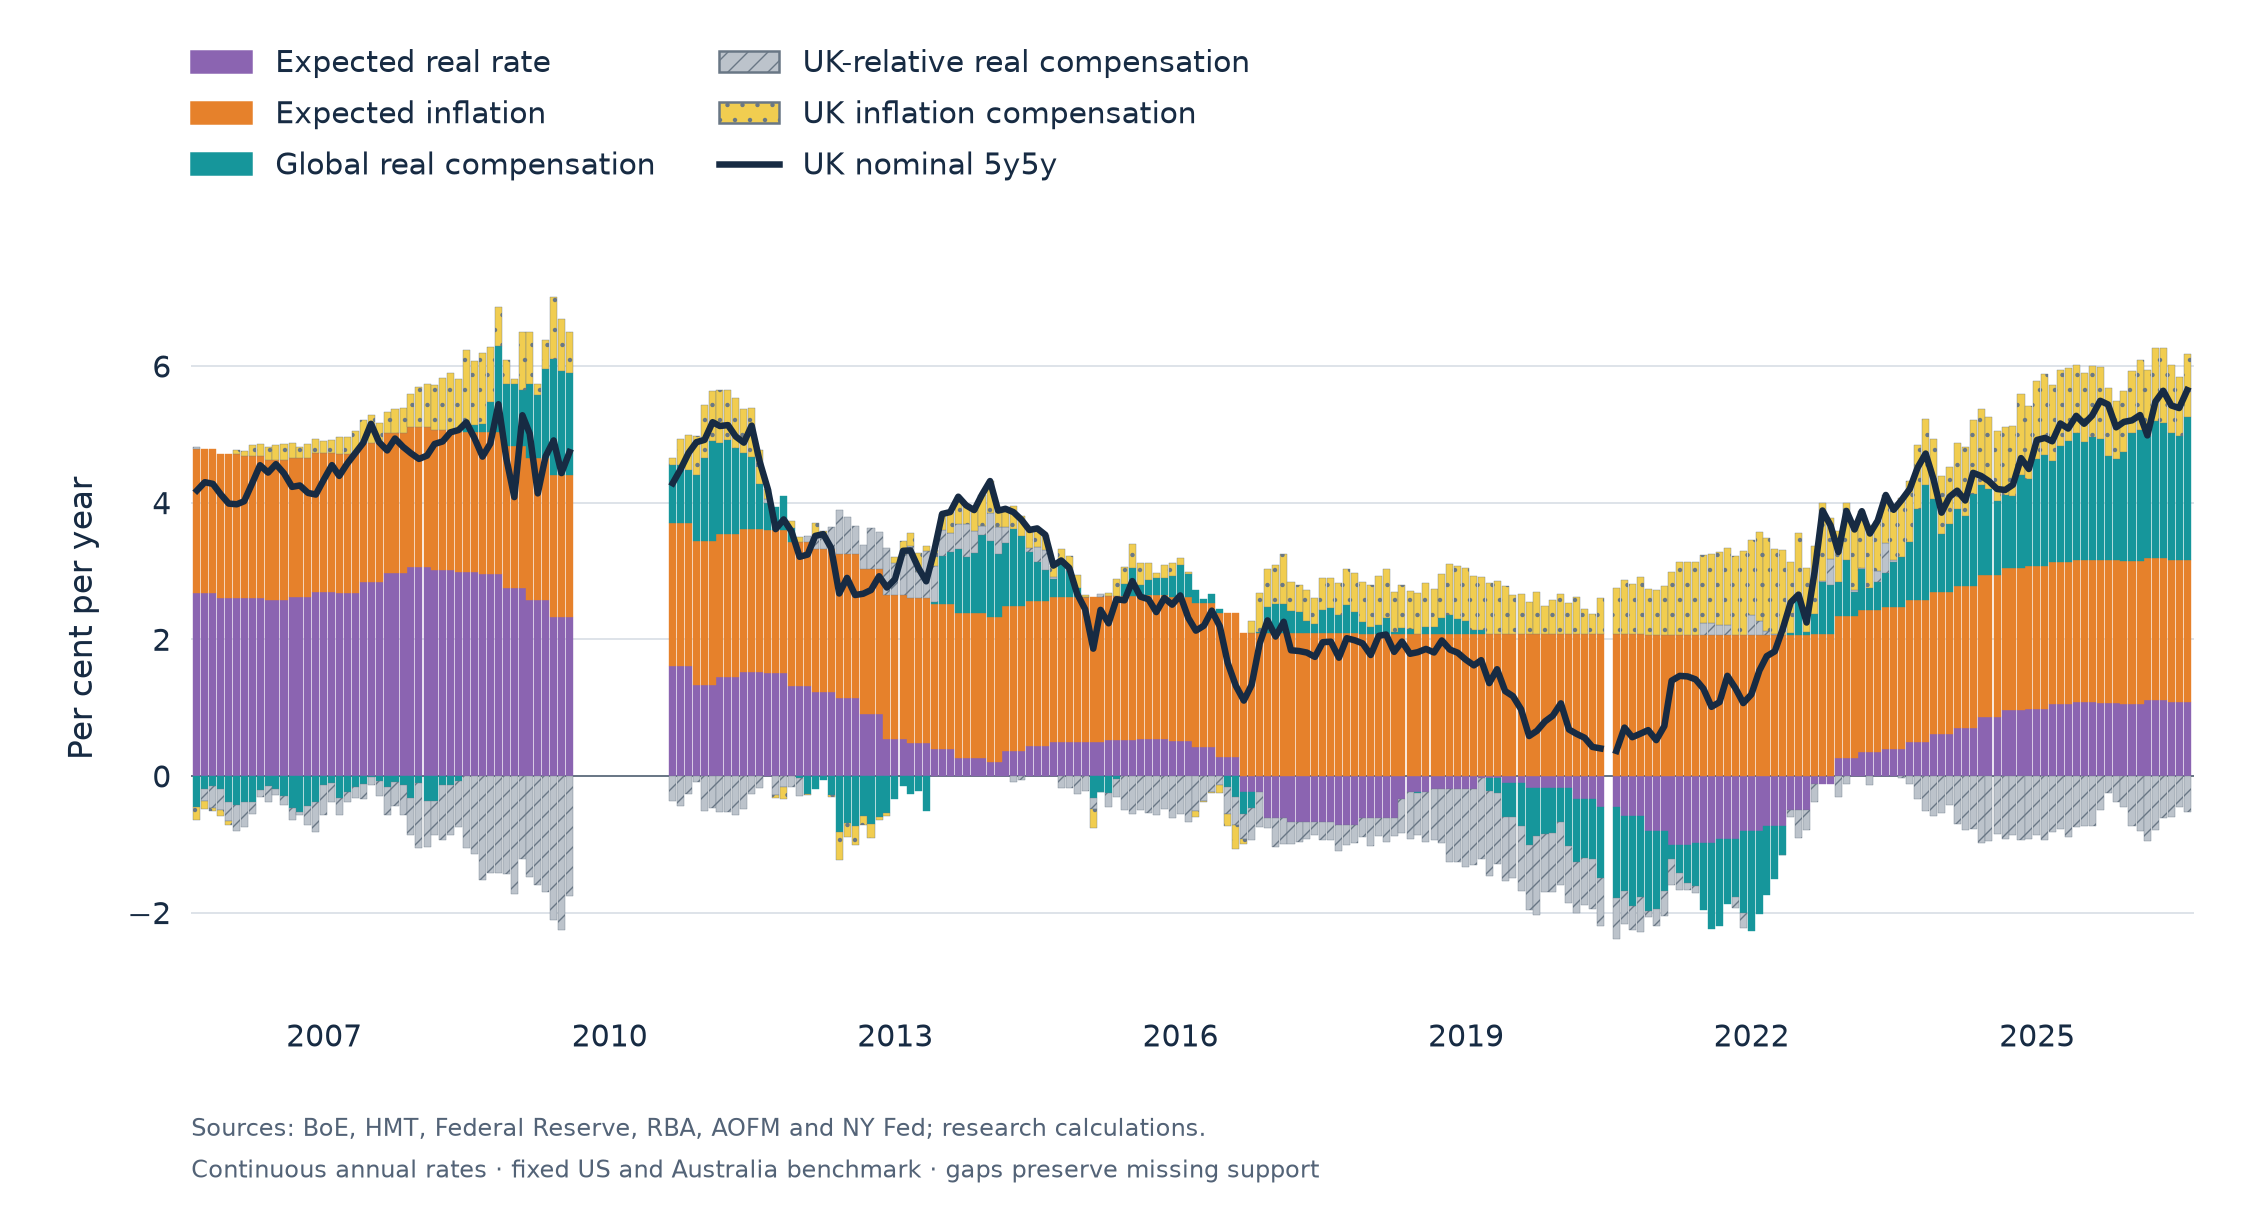
Monthly UK five-component history from August 2005 to July 2026 using a fixed US and Australian macro benchmark, with visible gaps where the common market inputs lack support.
Monthly levels, August 2005 to July 2026. Fixed equal-weight US and Australian benchmark; the country composition does not change through the chart. Sources: public central-bank, survey and market datasets; research calculations. The UK inflation and expected-rate inputs are shared with Chart 1. August 2009–July 2010 and June 2020 lack Australian five-year real-curve support. A US-only fill would change the benchmark membership and introduce a splice.

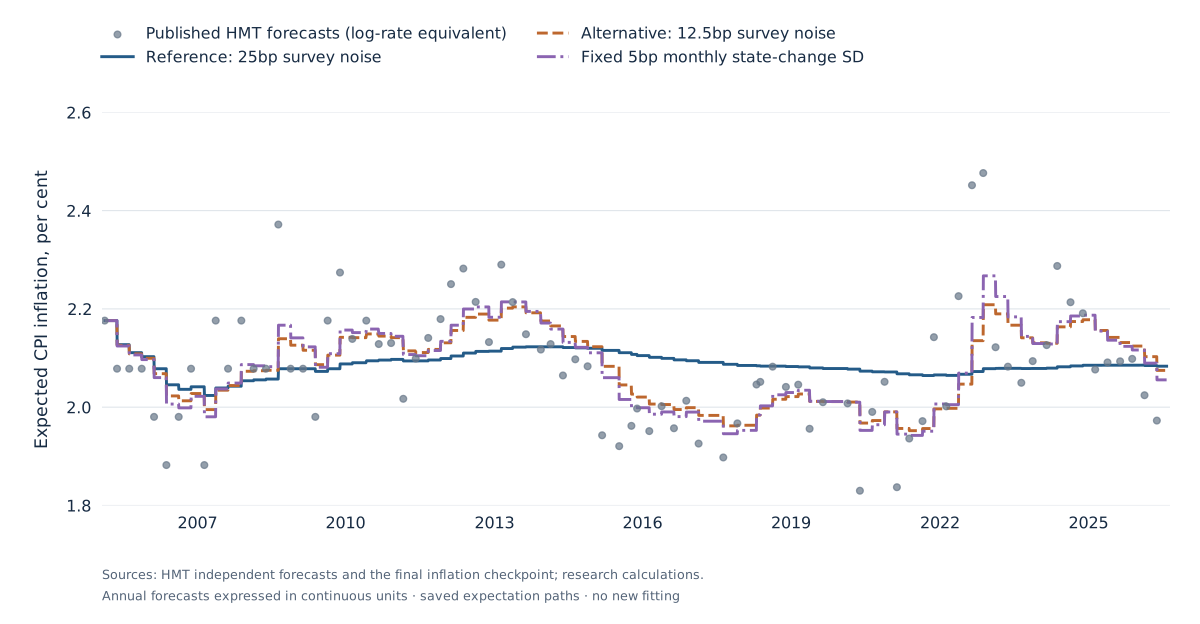
Chart 5. Why do inflation expectations look so flat?
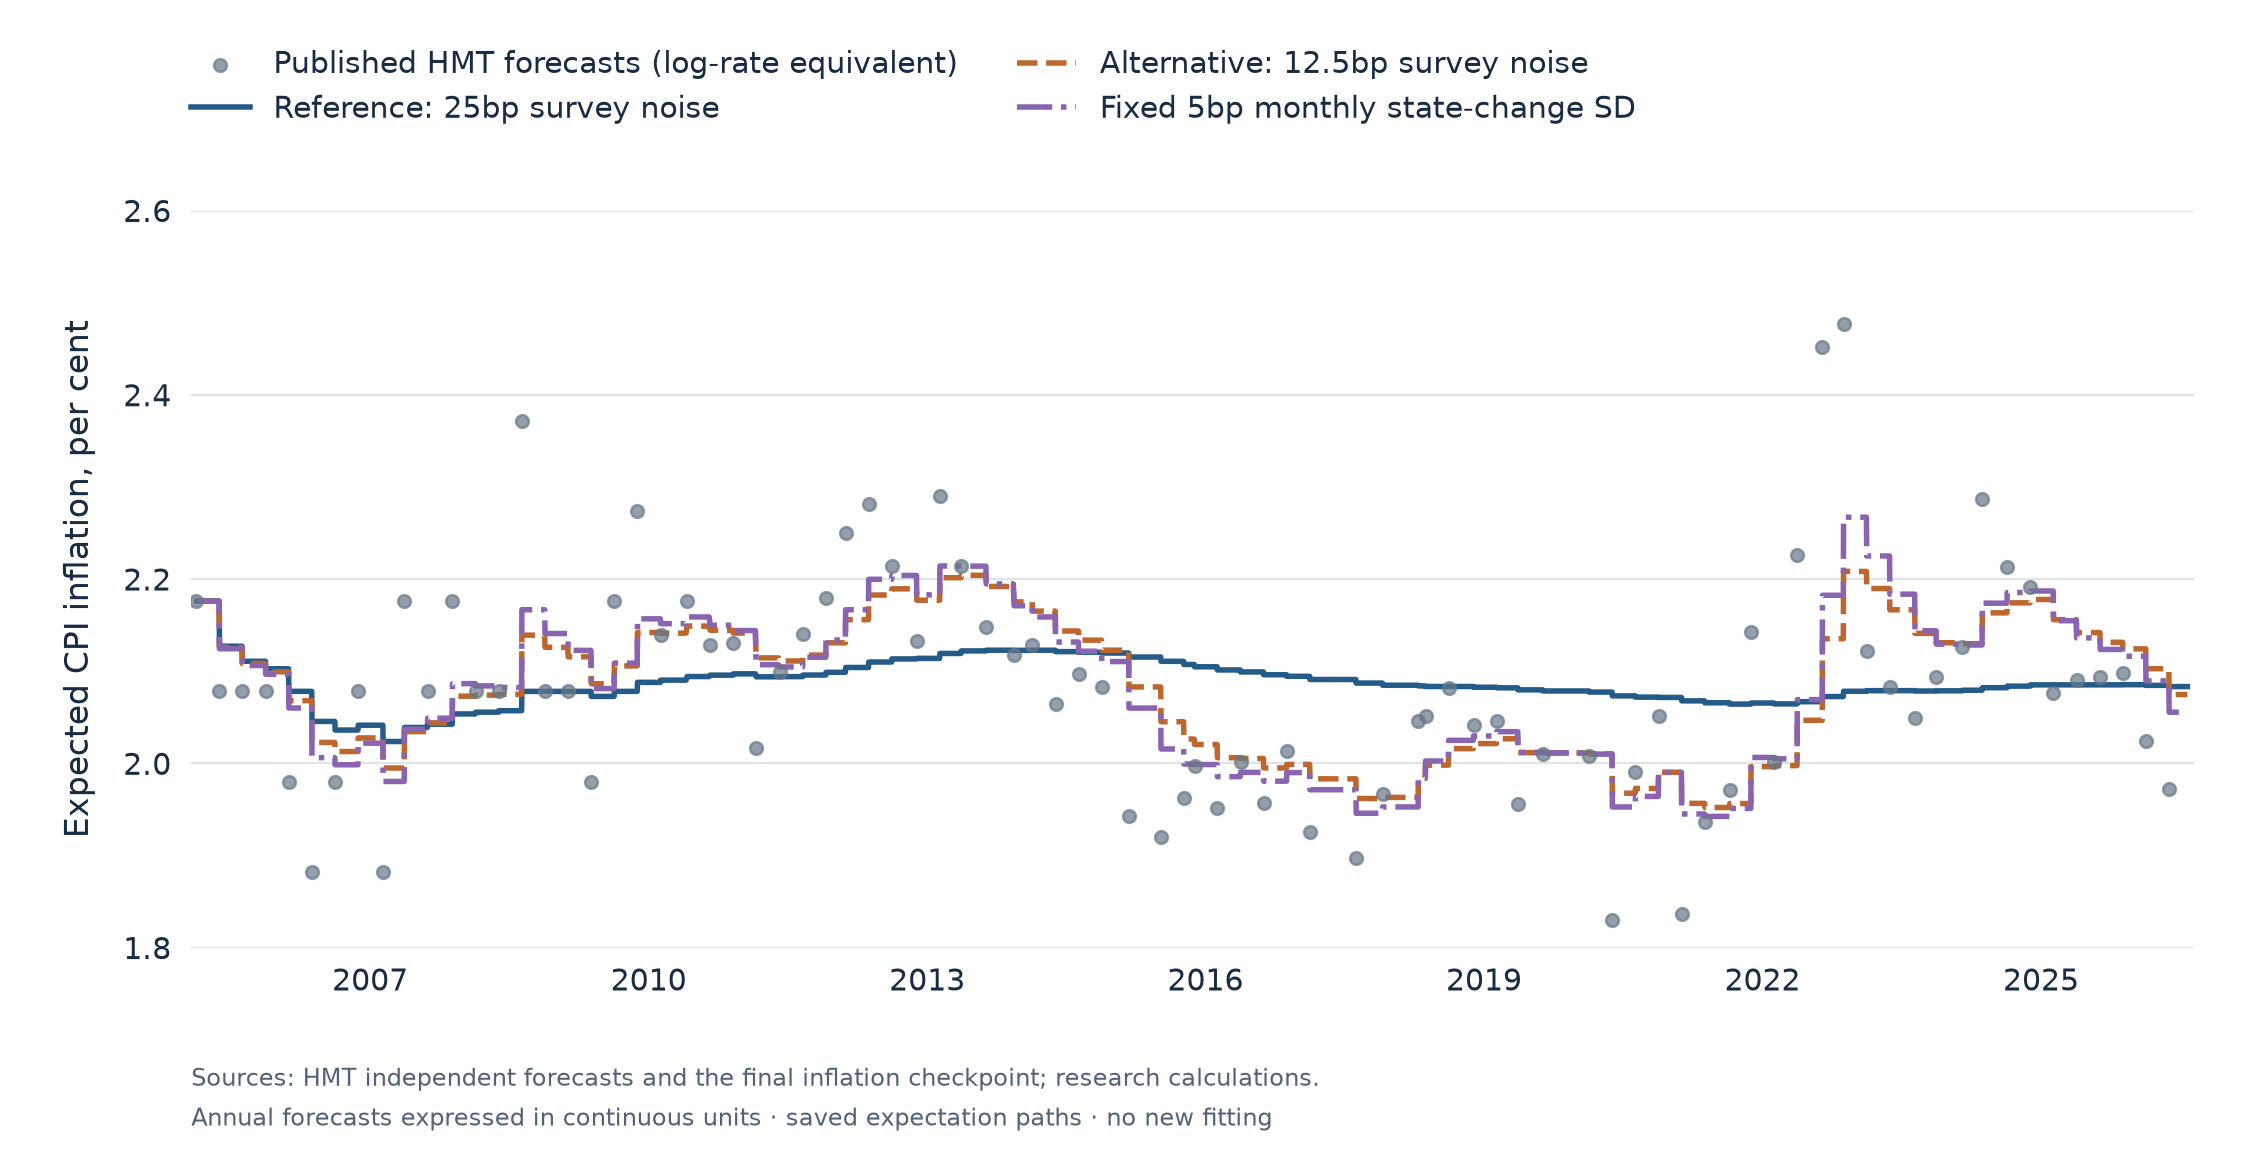
HMT terminal-year CPI forecasts and three saved expectation paths on a 1.8 to 2.6 per cent scale. The reference is much smoother than the source forecasts and the responsive alternatives.
The final checkpoint: published HMT terminal-year CPI forecasts, converted to log rates, alongside the retained reference and responsive alternatives. With 25 bp assumed survey noise, the reference likelihood selects zero state innovation; it is an expanding average, not an observation of constant beliefs.

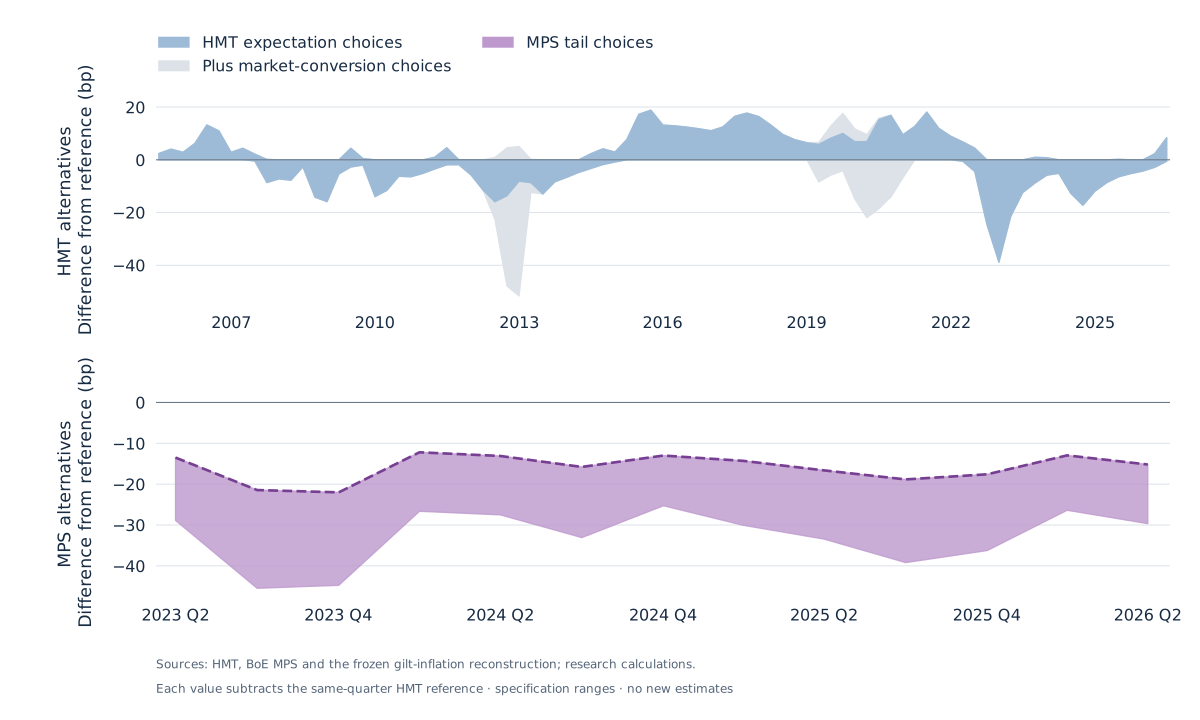
Chart 6. How much do the assumptions change inflation compensation?
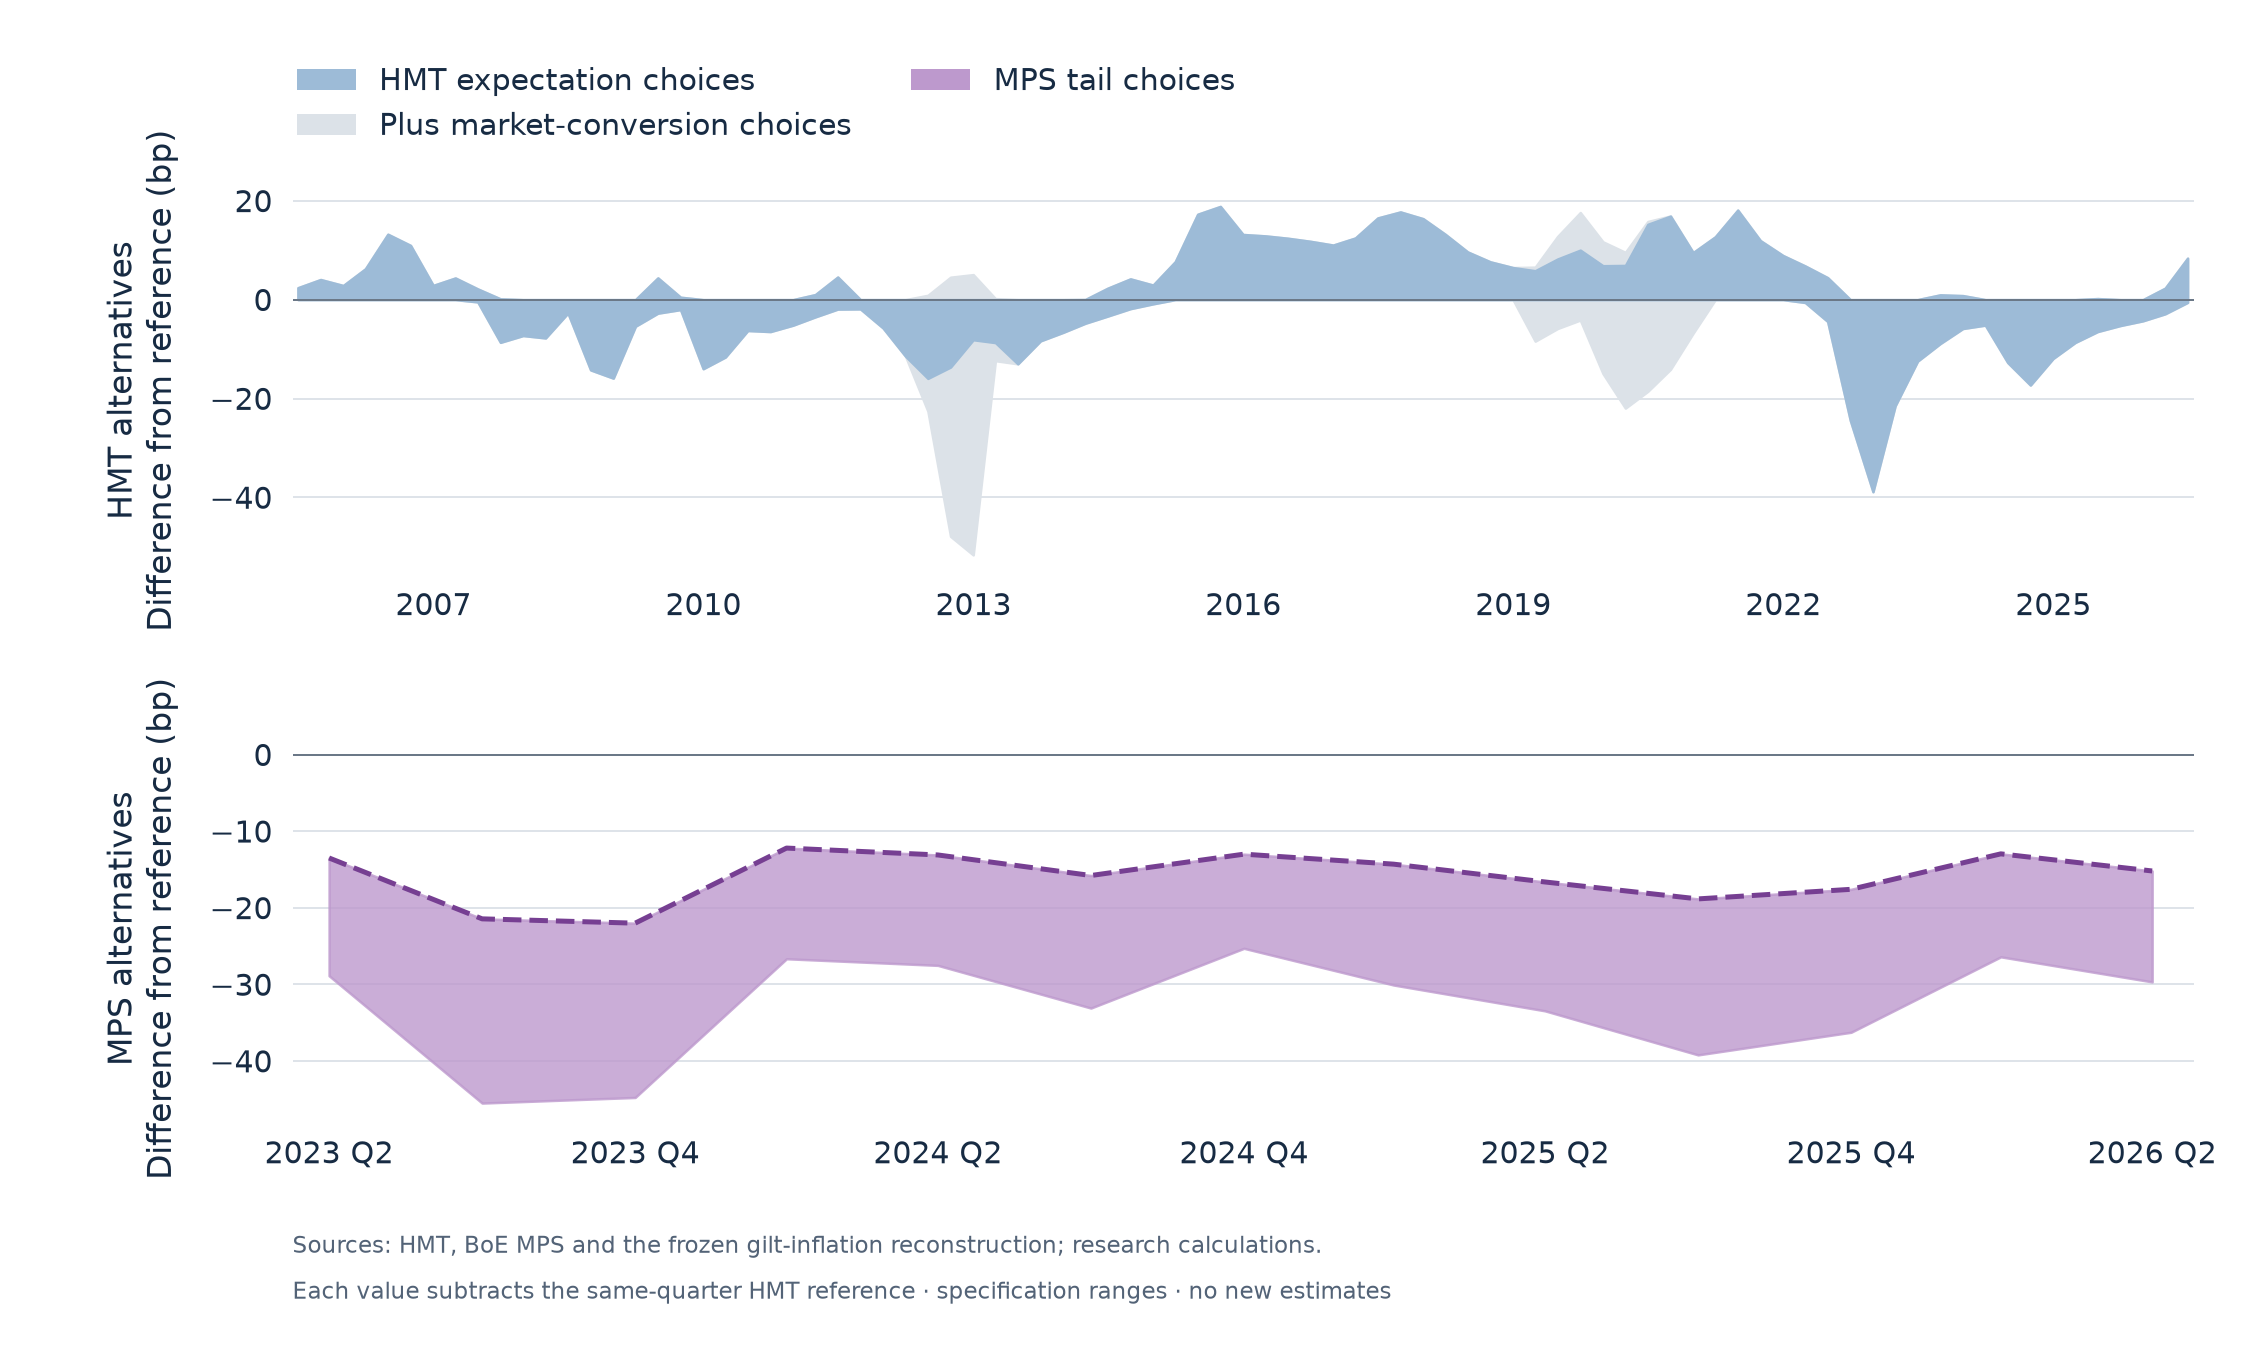
Ranges of inflation-compensation differences from the same-quarter HMT reference. The upper panel varies HMT expectations and market conversion; the lower panel compares MPS tail assumptions from 2023.
Differences from the same-quarter HMT reference, in basis points. The upper panel isolates HMT expectation choices and market-conversion choices; the lower panel shows the separate MPS tail envelope from 2023. These are ranges across specifications, not confidence intervals.

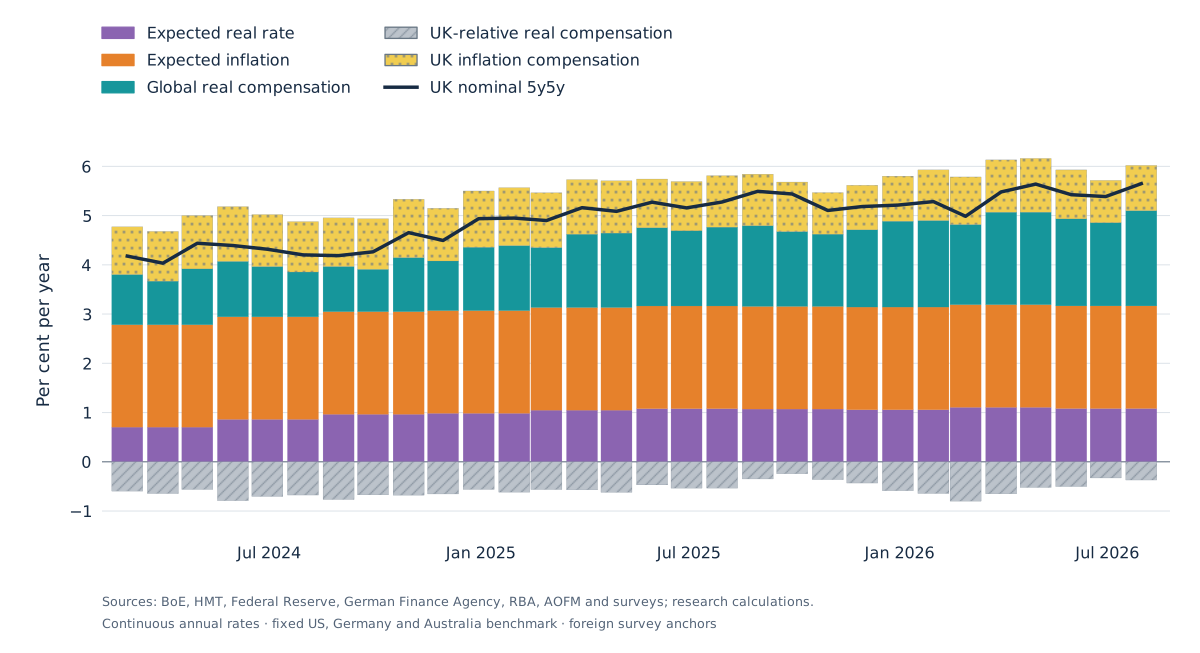
Chart 7. The recent three-market survey comparison
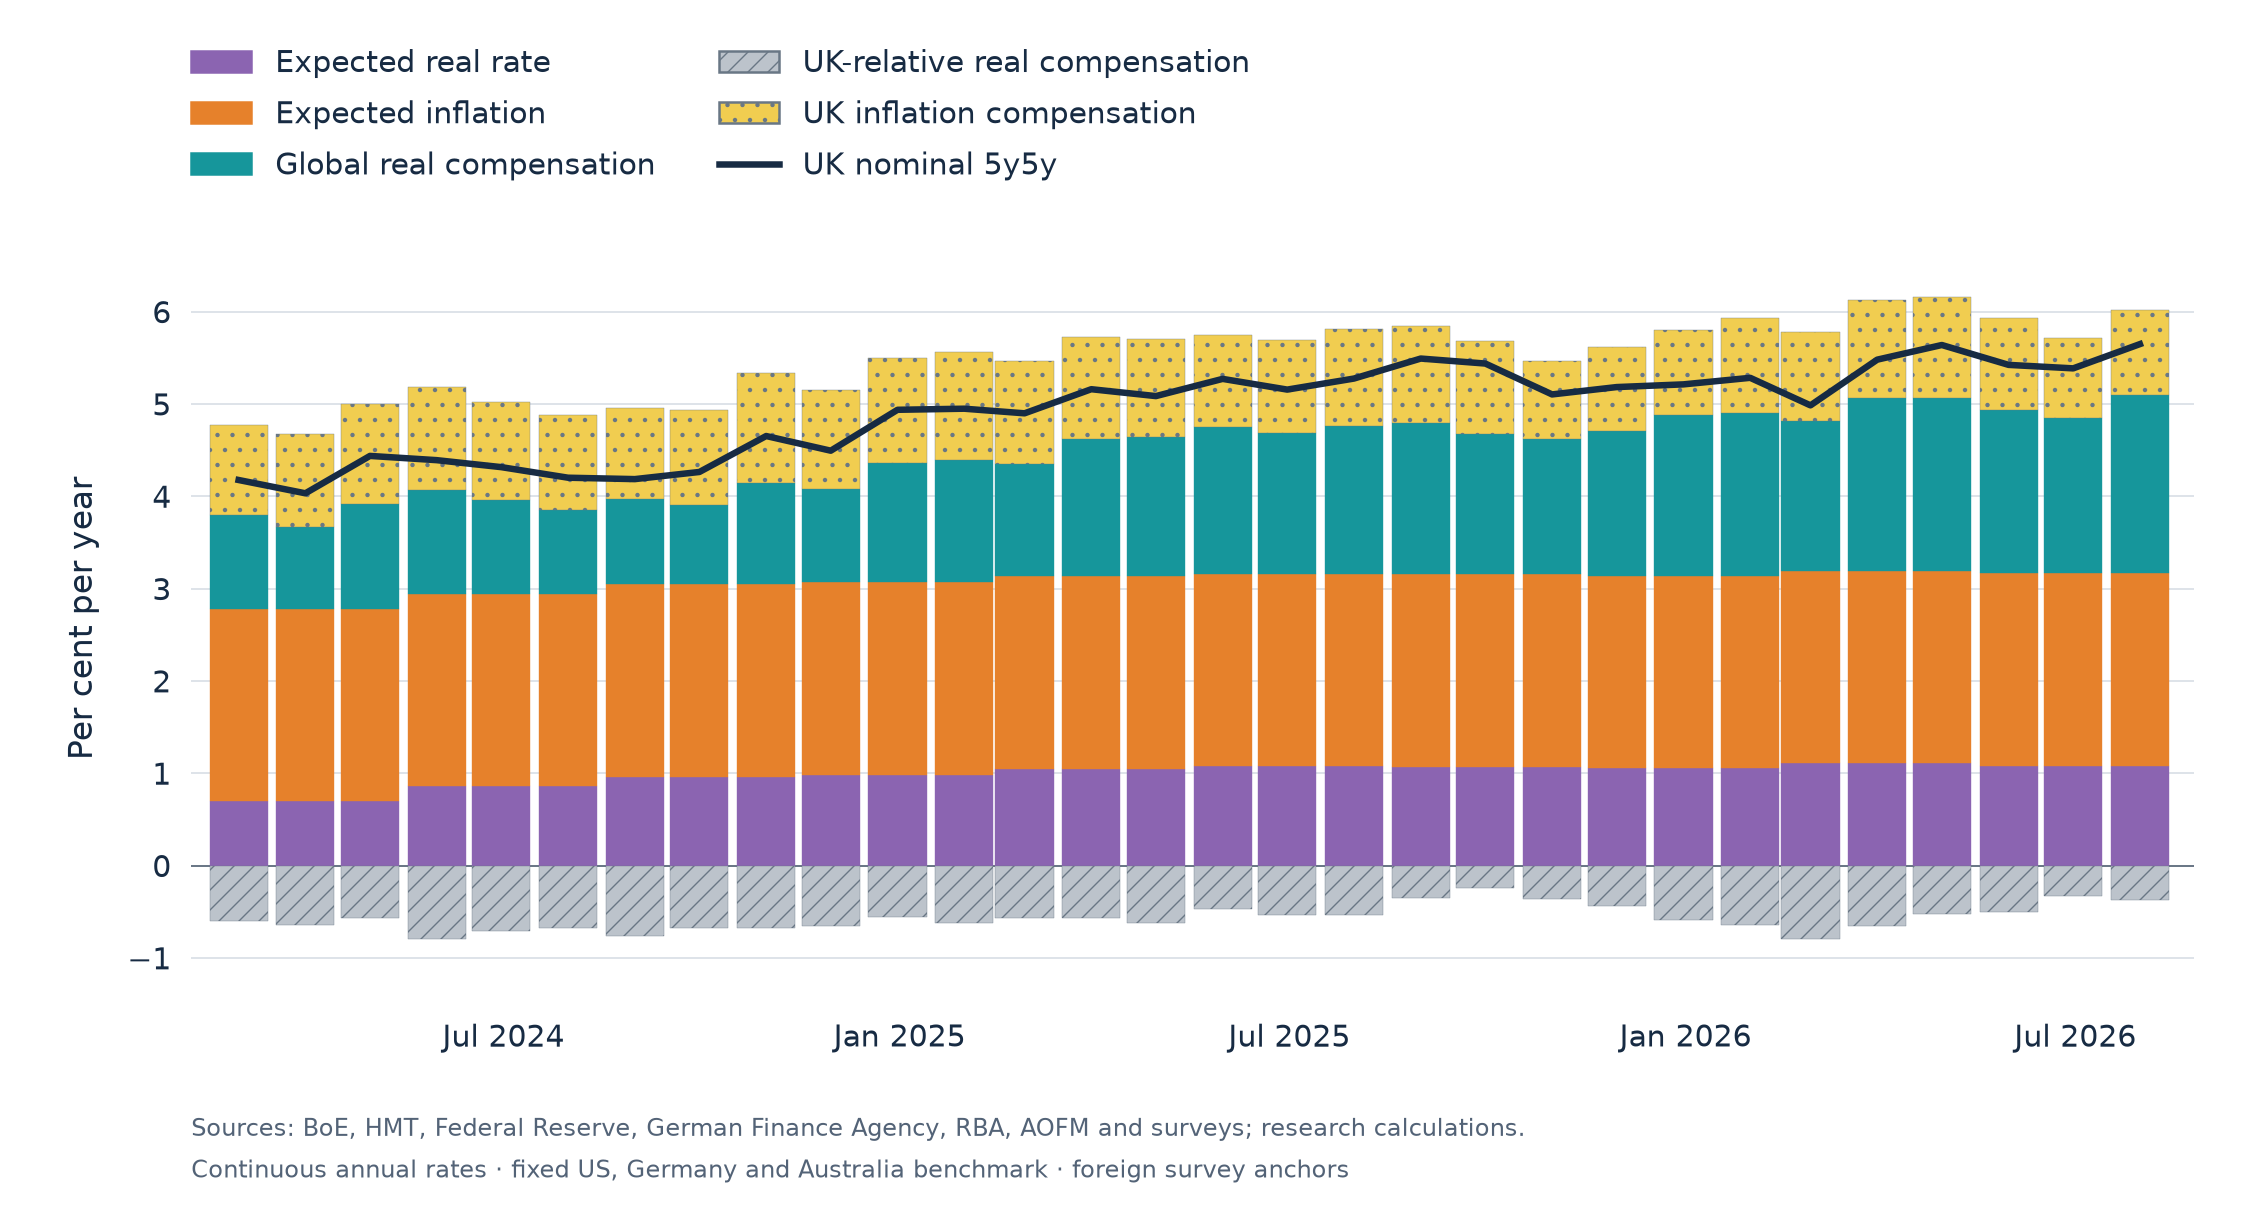
Five-component UK nominal 5y5y levels from February 2024 to July 2026 using independent survey anchors for the fixed US, German and Australian benchmark.
February 2024–July 2026. Fixed equal-weight US, German and Australian benchmark using foreign survey anchors; actual levels. UK expectations retain the HMT reference. This is a separate recent specification, not a splice into the macro history.

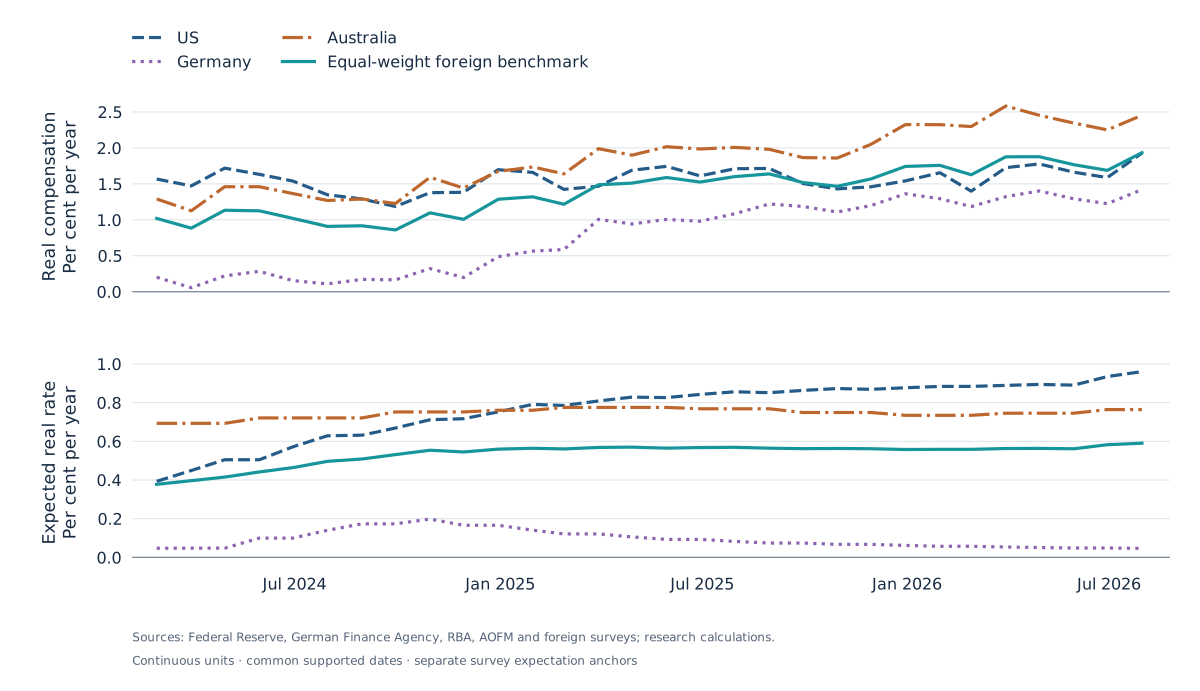
Chart 8. Foreign expected real rates and compensation
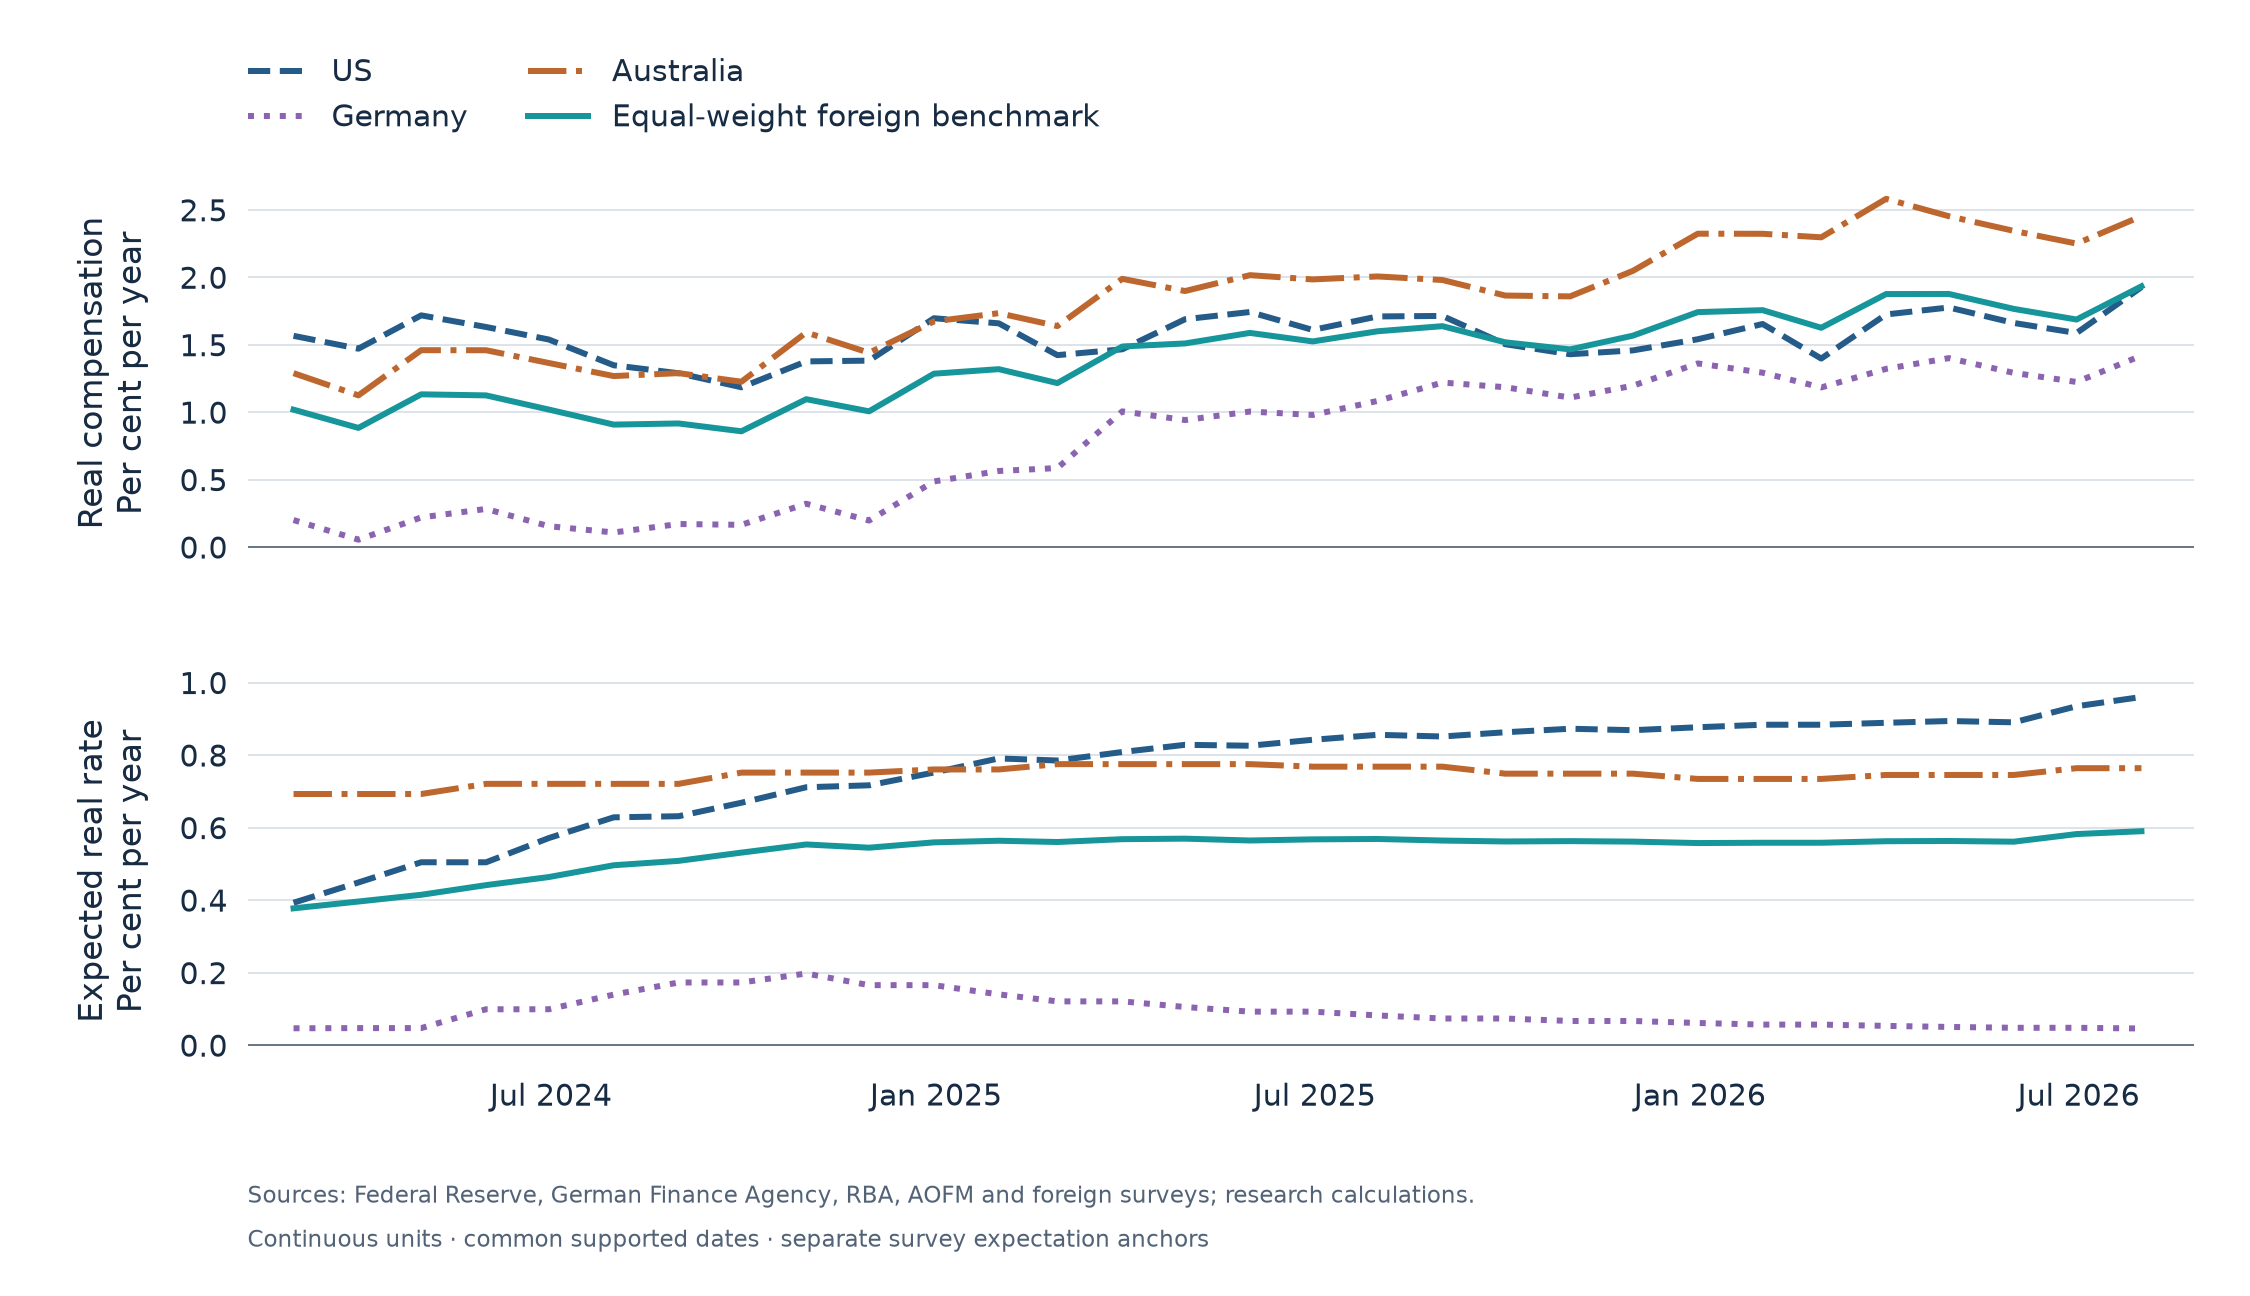
Foreign real compensation and expected real rates in separate panels, for the US, Germany, Australia and their equal-weight benchmark, February 2024 to July 2026.
Survey-based country components and their equal-weight average. The foreign expected-real average is a separate diagnostic; it is not counted again in the UK five-component identity.

Chart 9. The longer foreign real-rate history
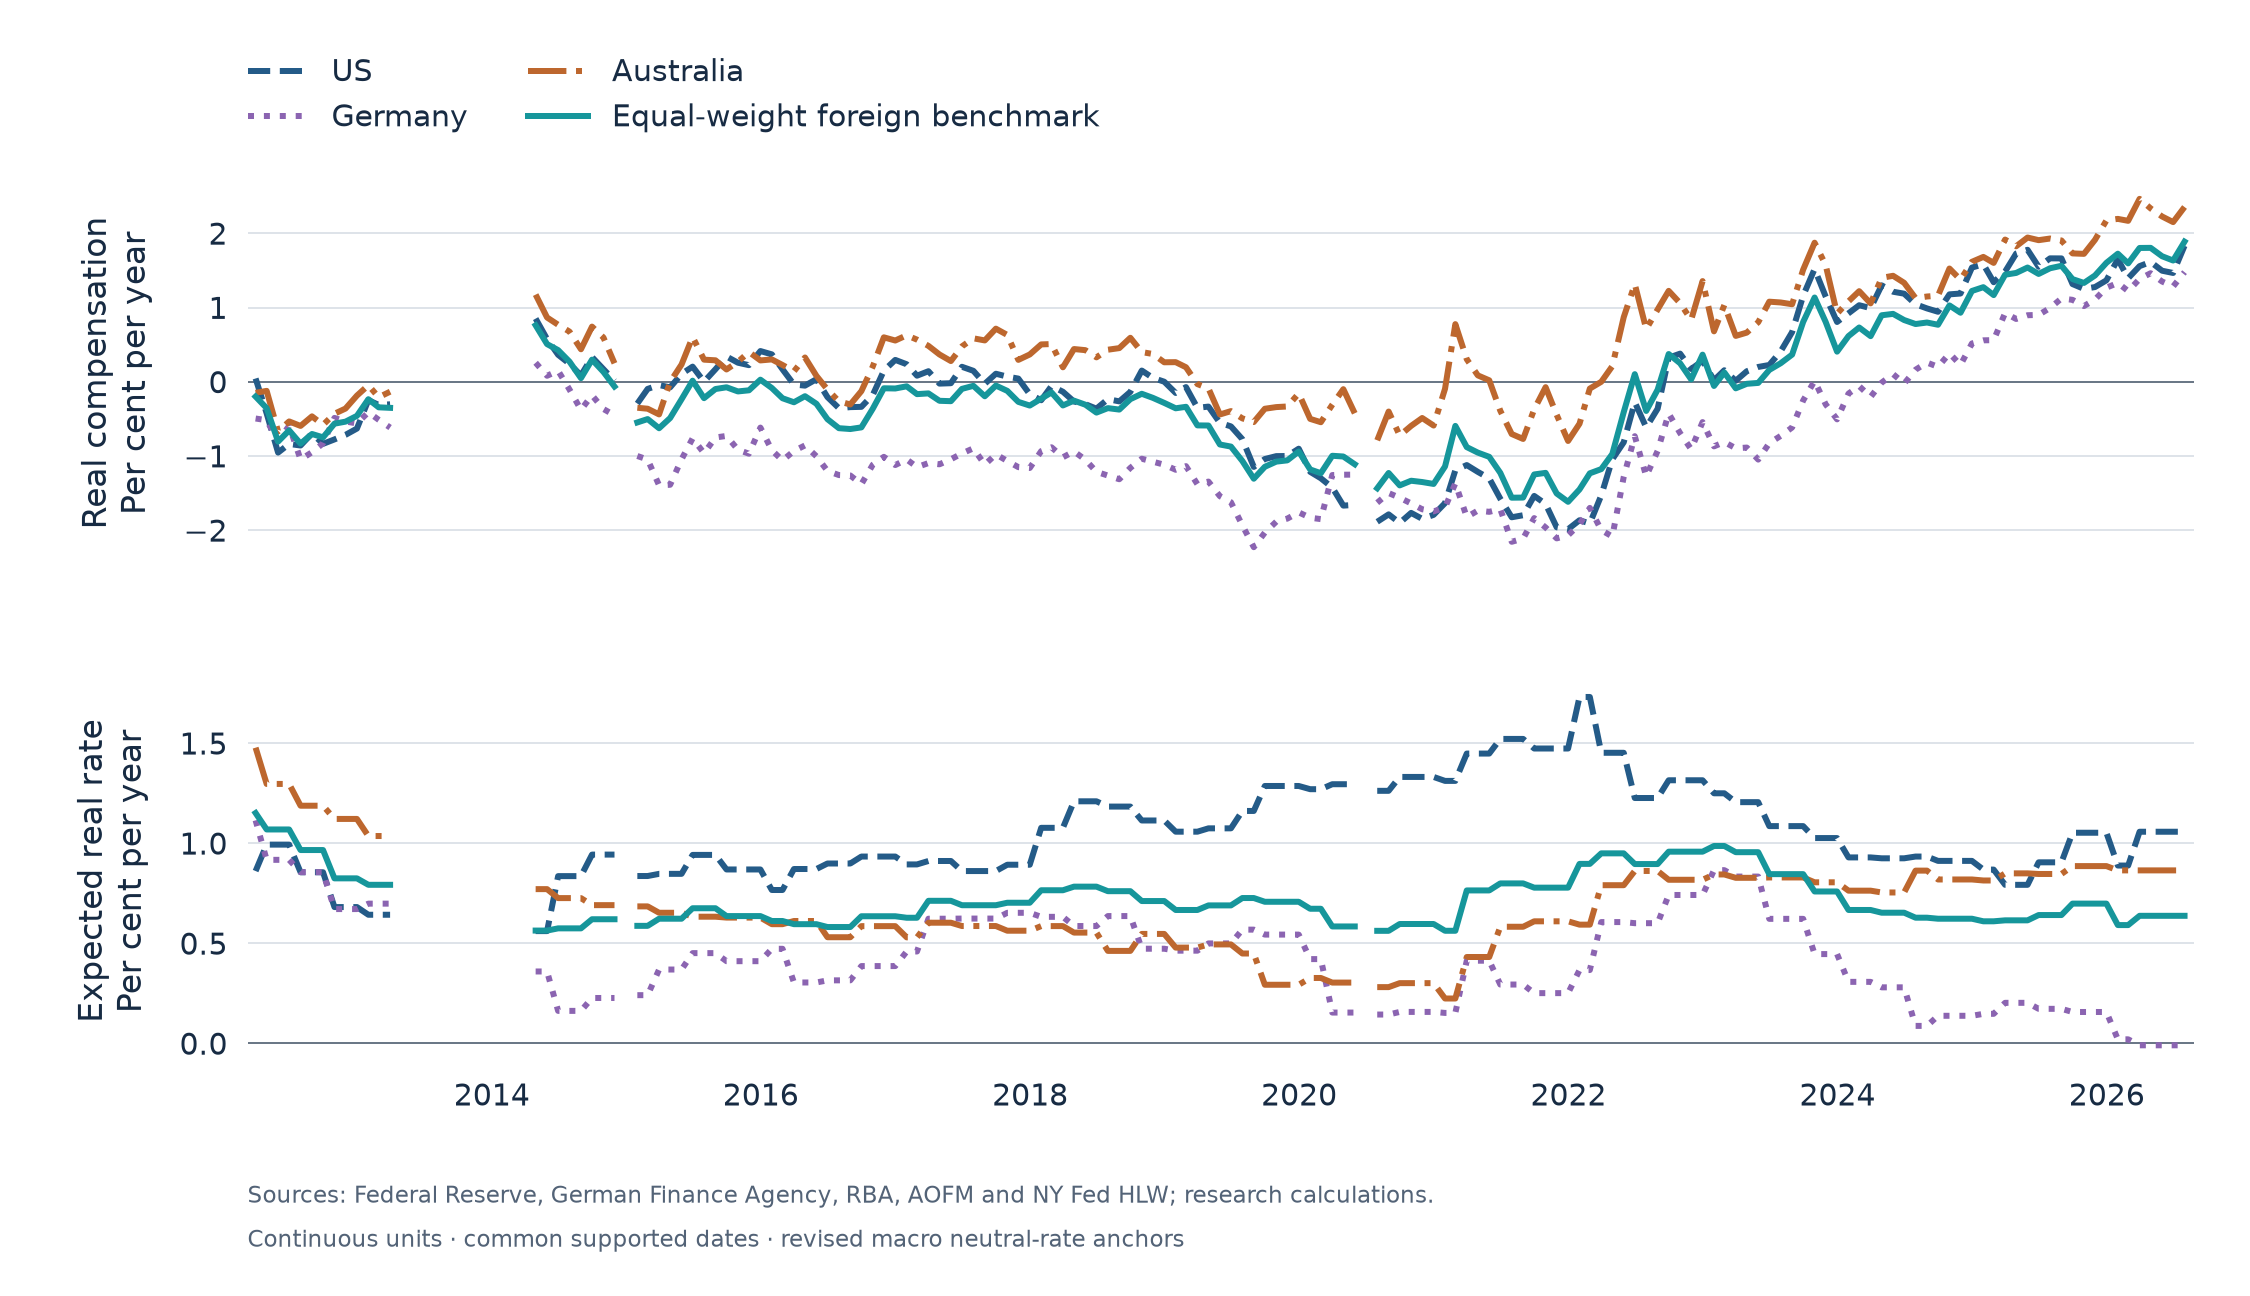
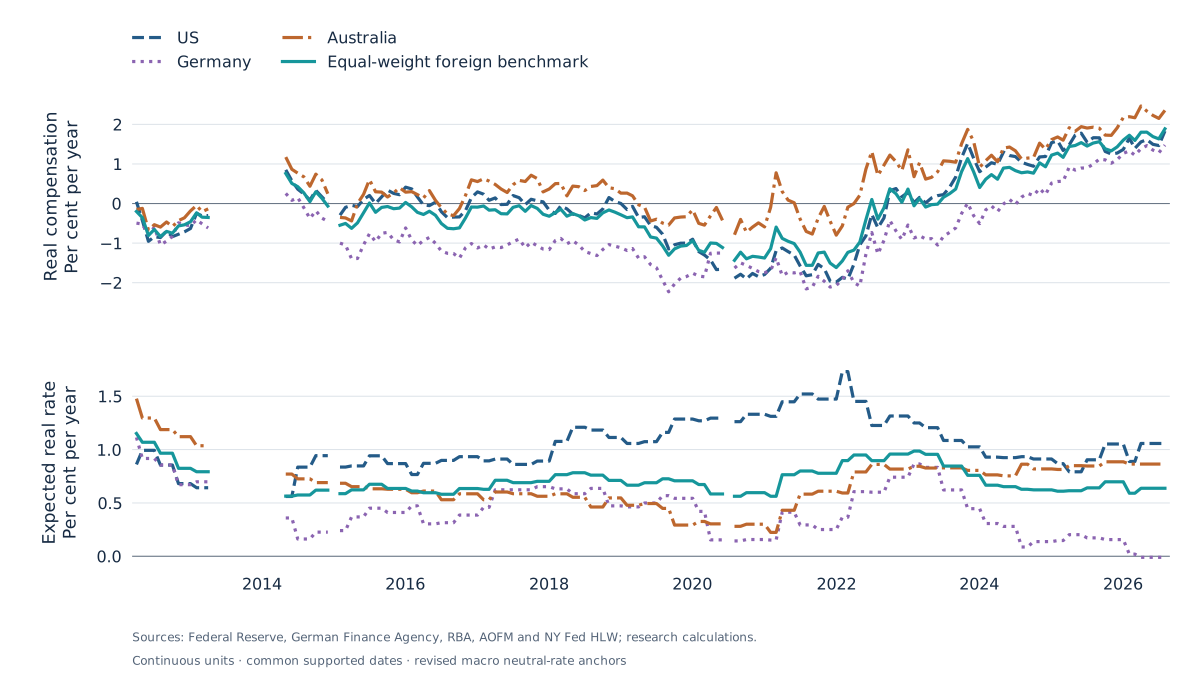
Longer histories of US, German and Australian real compensation and macro expected-real anchors, with equal-weight benchmark lines and blank unsupported months.
Country expected real rates and compensation using retrospectively revised macro neutral-rate anchors. Three-market gaps in April 2013–March 2014 reflect German maturity support; December 2014 fails the common-date rule; June 2020 lacks Australian five-year support.

Chart 10. How much does a broader benchmark change the UK component?
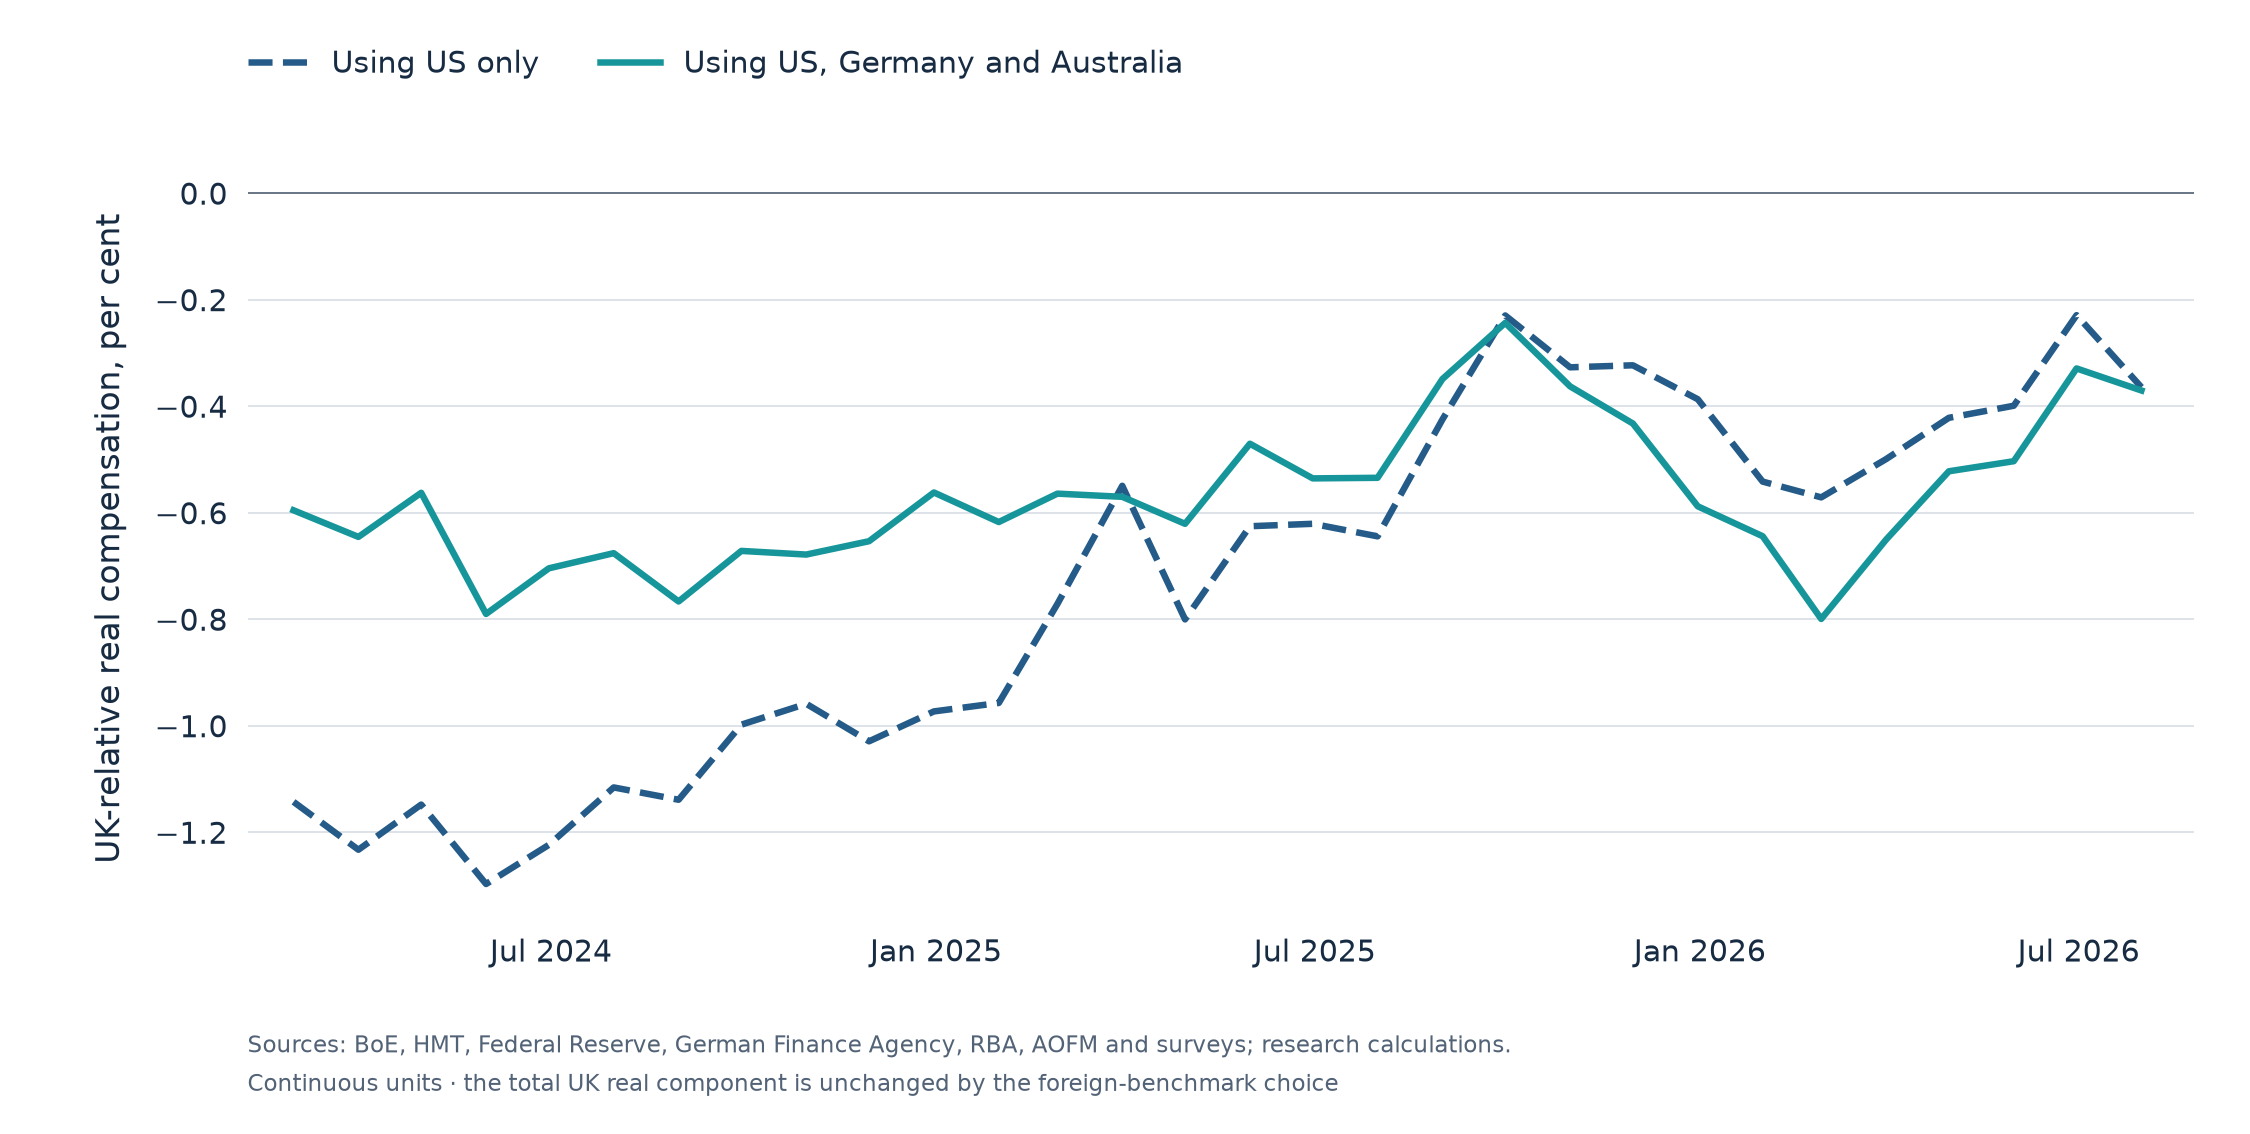
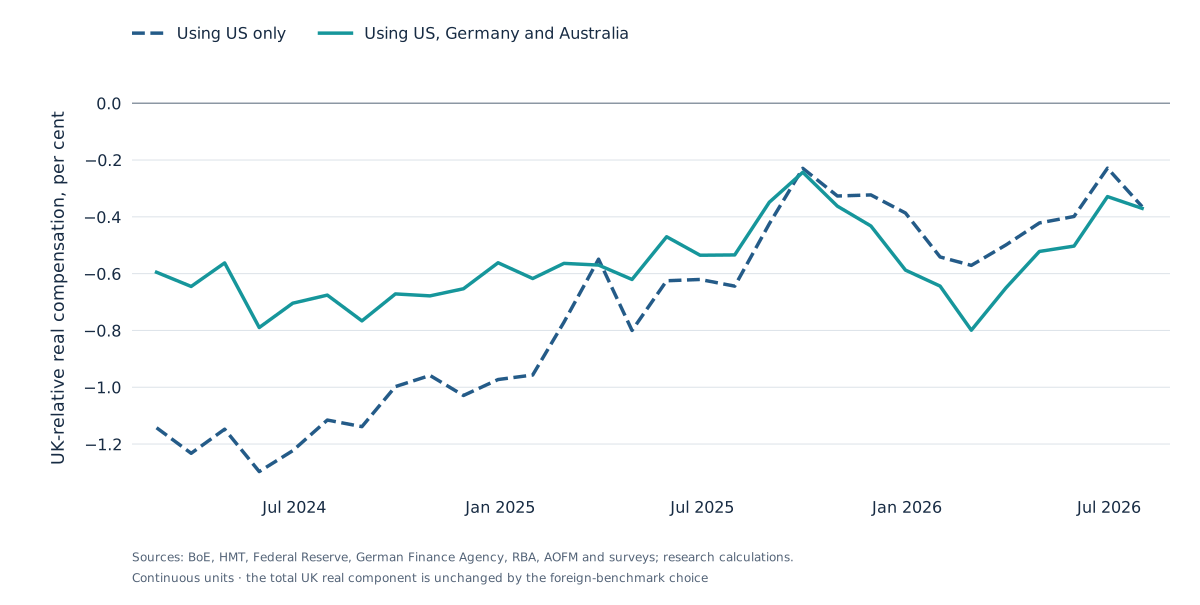
UK-relative real compensation using the US alone and the equal-weight US, German and Australian benchmark. The two paths converge near July 2026 but differ earlier in the sample.
UK-relative real compensation under US-only and three-market survey benchmarks. Similarity at the July 2026 endpoint does not imply identical histories; in 2024 the differences are substantial.

Chart 11. Individual components in the earlier US-proxy model
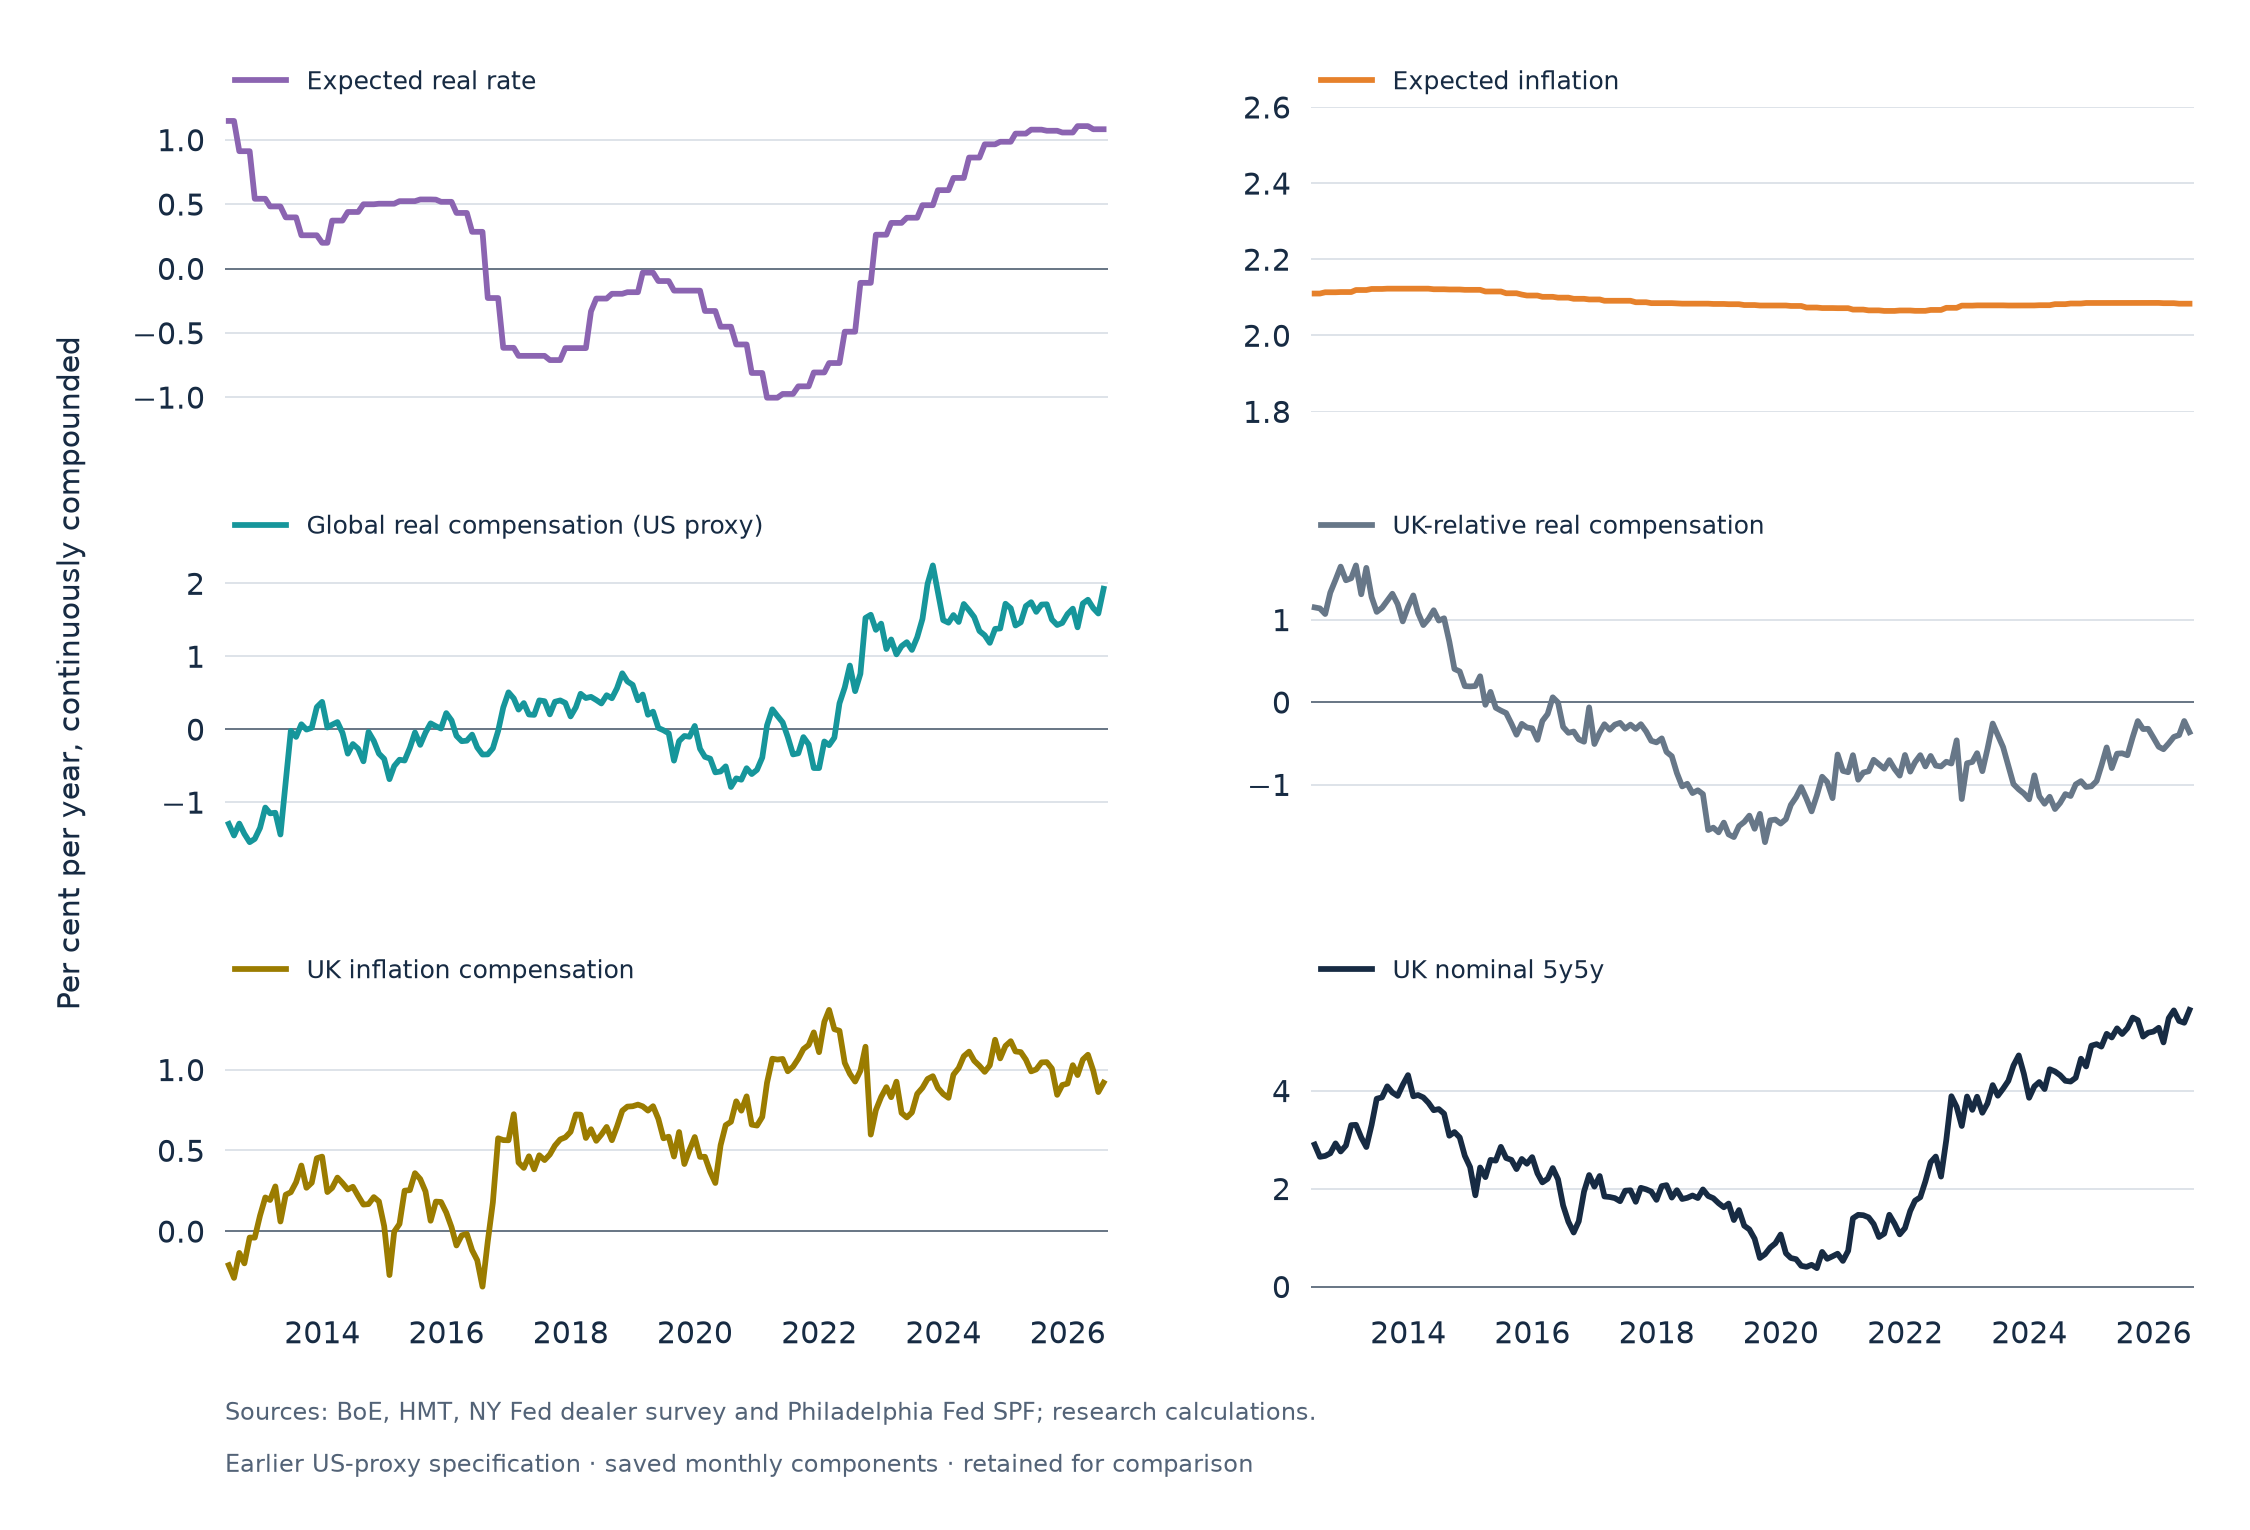
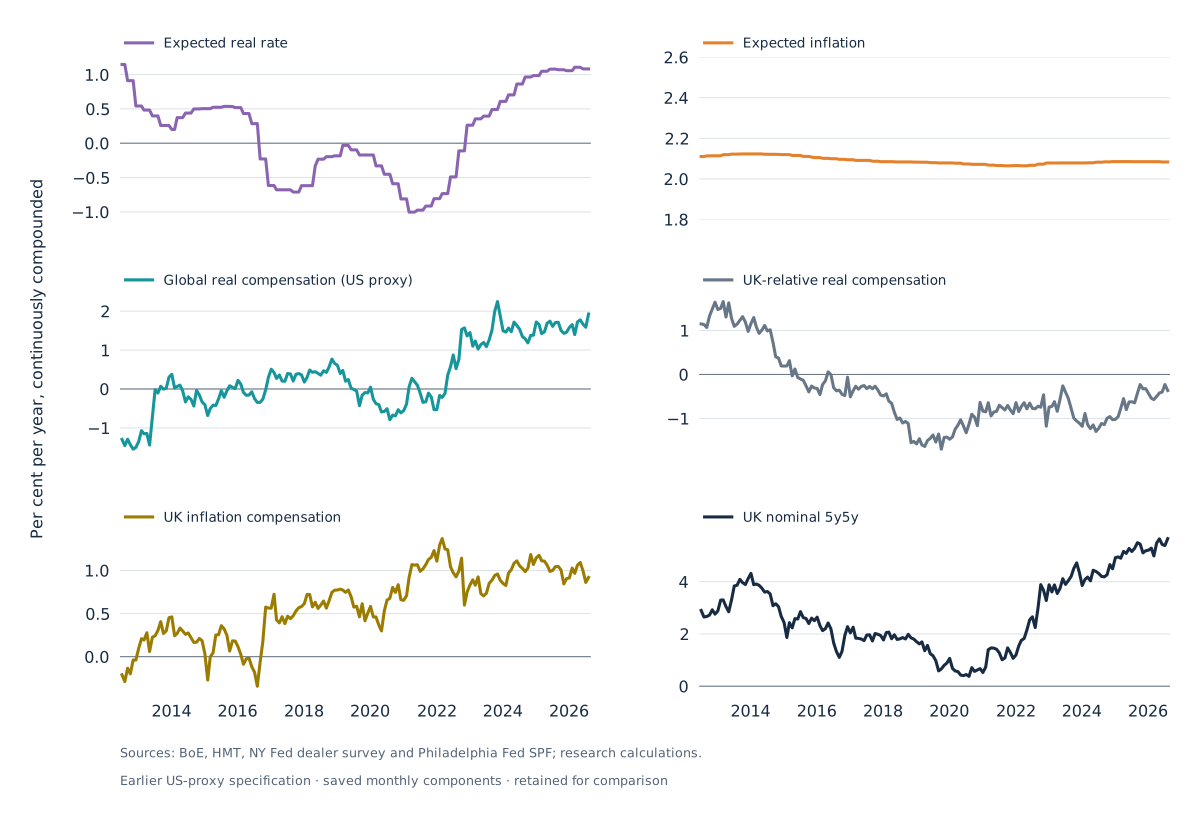
Six panels show the earlier US-proxy decomposition and UK nominal forward. The expected-inflation panel uses a 1.8 to 2.6 per cent scale; all values are unchanged frozen estimates.
Earlier US-proxy specification, June 2012–July 2026, retained for comparison. The current broader benchmark appears in Figures 1 and 7. The expected-inflation axis is 1.8–2.6 per cent to expose the movement in this component.

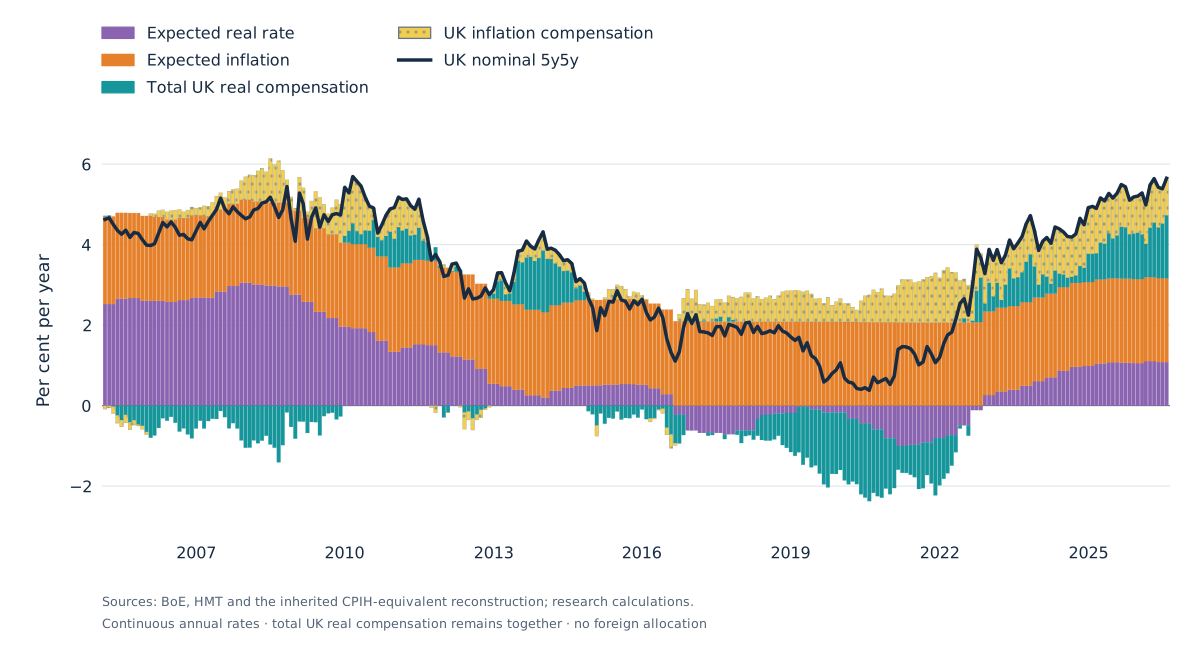
Chart 12. UK context from 2005

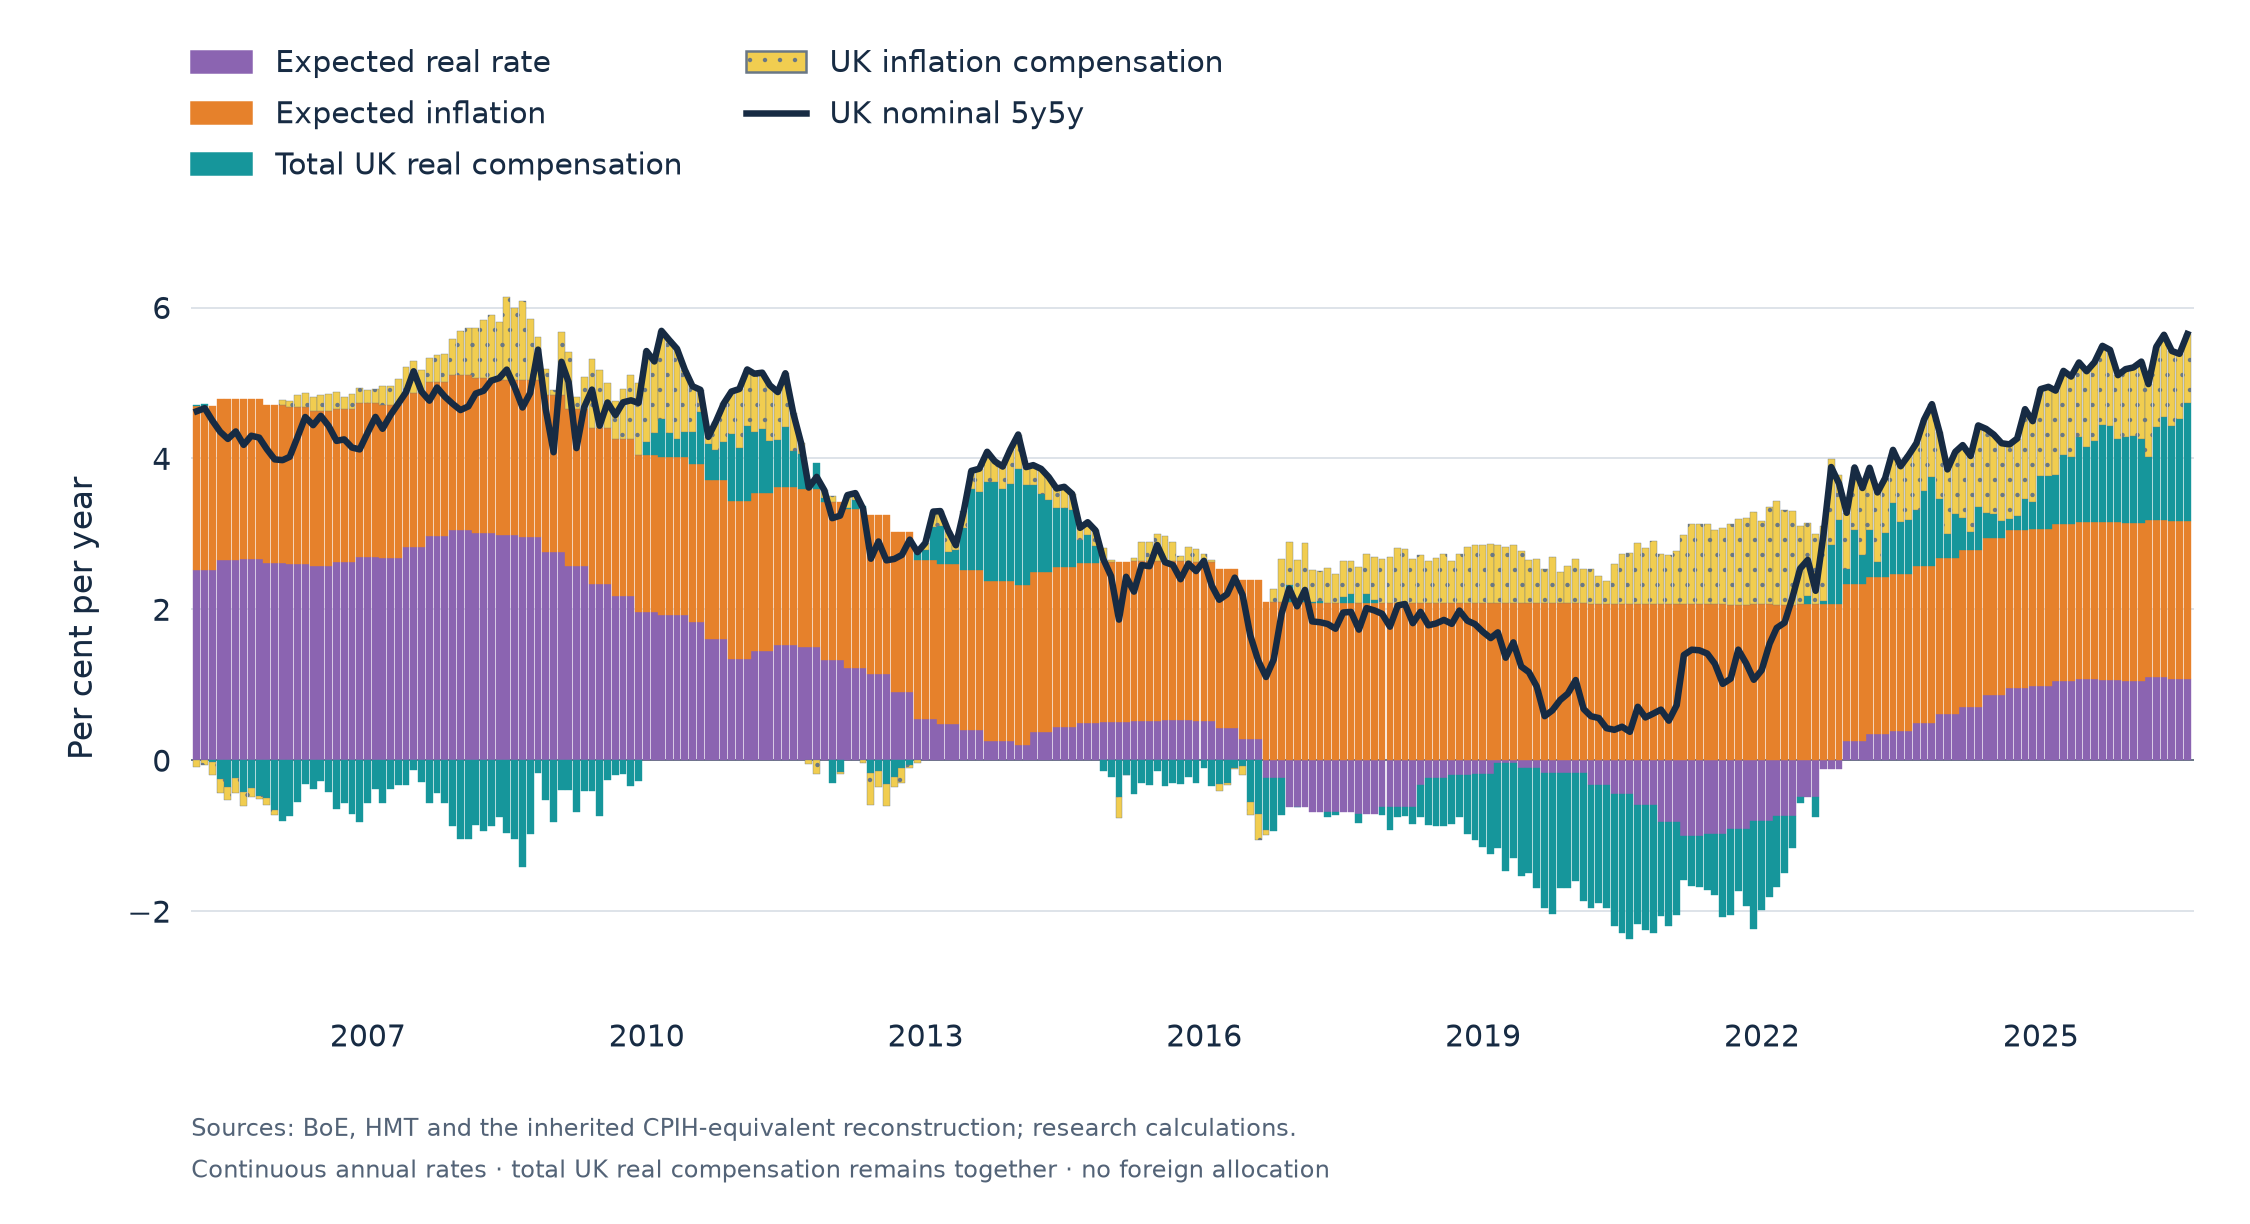
UK nominal 5y5y since February 2005 divided into expected real rates, expected inflation, total real compensation and inflation compensation. This UK-only context has no global/local real split.
February 2005–July 2026. Earlier UK context keeps total real compensation together; it does not provide a separate global and UK-relative real split.